


What does a statistician do on a day off? He goes to Rightmove, and makes himself ill by looking up the prices of his first London flat, in dear old Bow E3.
Because statisticians never take the day off, not really, I plotted the sales price for the property against time, which I’ve measured as the number of days from 26 November 1997, when the property was first built and sold.
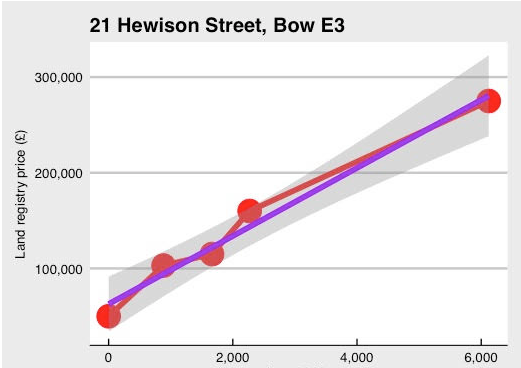
The red dots show the price recorded at the Land Registry for each sale. We can see the flat has been sold five times between 1997 and 2014, marked with the red circles. The solid purple line is a best estimate of the linear trend in price over time.
At this point I was glad I’d sat down to perform the statistical calculations. In the 6,000 or so days since 21 Hewison Street E3 was built — from the dawn of New Labour to our current Brexit-obssessed days; that is, the span of my youth-to-middle-age; a mere breath — its value has risen at a rate of £35 a day. (And – of course! – my ownership coincided with the relatively flat change between the second and third sales.)