


A physical market cycle analysis of four property types across 54 metropolitan statistical areas (MSAs) for 3Q2020.
The V-shaped recovery happened (-32% GDP in Q2 then +33% GDP in Q3) but only for a portion of the economy. Any business dependent upon consumer contact was down or flat at best. Add the flat line to the V and we have a K-shaped recovery. Covid-adjustable jobs are doing okay as are ‘essential’ goods and service businesses. Most state governments are not headed toward a full stay-at-home shutdown; thus, the recovery length and speed are dependent upon the deployment of vaccines. Most economists predict a recovery back to 2019 levels by the end of 2022, which is a long, slow recovery. Real estate should follow this recovery in a covid ‘have’ versus ‘have-not’ tenant fashion that is discussed in each property section below. Low interest rates may help save many real estate investments.
Office occupancy declined 0.6% in 3Q20, and rents declined 0.6% for the quarter and were down 1.0% annually. Industrial occupancy declined 0.1% in 3Q20, and rents grew 0.7% for the quarter and 4.8% annually. Apartment occupancy declined 0.1% in 3Q20, and rents declined 0.2% for the quarter, and were down 0.6% annually. Retail occupancy declined 0.2% in 3Q20, and rents declined 0.6% for the quarter and were down 0.4% annually.
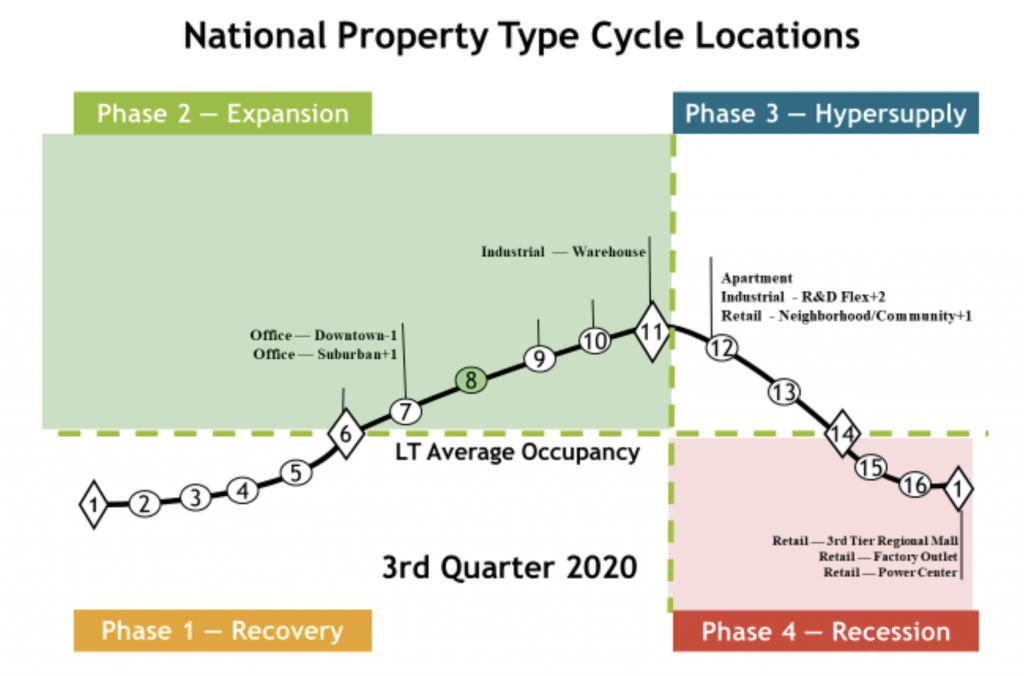
Note: Graph shows relative positions of the sub-property types.
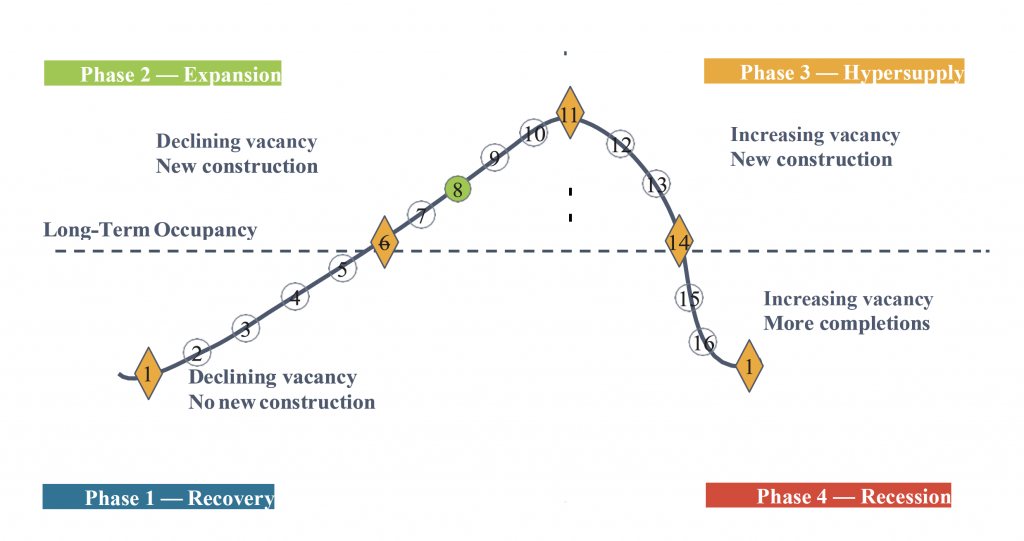
The cycle monitor analyses occupancy movements in five property types in 54 MSAs. Market cycle analysis should enhance investment-decision capabilities for investors and operators. The five property type cycle charts summarise almost 300 individual models that analyse occupancy levels and rental growth rates to provide the foundation for long-term investment success. Commercial real estate markets are cyclical due to the lagged relationship between demand and supply for physical space. The long-term occupancy average is different for each market and each property type. Long-term occupancy average is a key factor in determining rental growth rates — a key factor that affects commercial real estate income and thus returns.
Market cycle quadrants
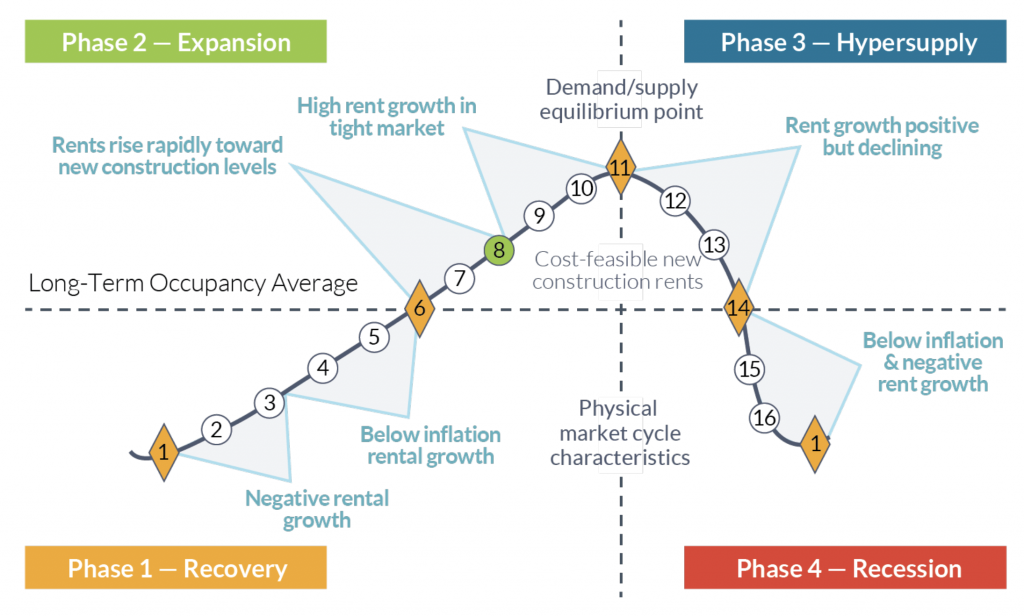
Rental growth rates can be characterised in different parts of the market cycle, as shown below.
Offices
The national office market occupancy level declined 0.6% in 3Q20 and was down 1.0% year-on-year. This decline pushed the national office occupancy level back down to point #7 on the cycle graph. New supply of 61 million sq. ft plus 50 million sq. ft of sublease (especially in tech markets) created a negative 34 million sq. ft net absorption in 3Q20. Leasing levels were similar to the great recession, as firms delayed new long-term lease decisions and chose short-term renewals/extensions. Everyone is trying to figure out what covid-compliant office space should look like. Office using employment is still 2 million jobs below the 1Q20 peak. Surveys show 85% of employees prefer to be in the office most of the time – leading to the expectation of a full recovery in the long term. Average national rents decreased 0.5% in 3Q20 and produced a 0.1% asking rent increase year-over-year.