


Following the crash of 2008/2009 the S&P 500 went on a record-breaking run, gaining around 400% over 11 years before peaking in early 2020.
It then suffered a record-breaking crash thanks to Covid-19, but that was short-lived and the US large-cap index is now setting all-time highs on a regular basis.
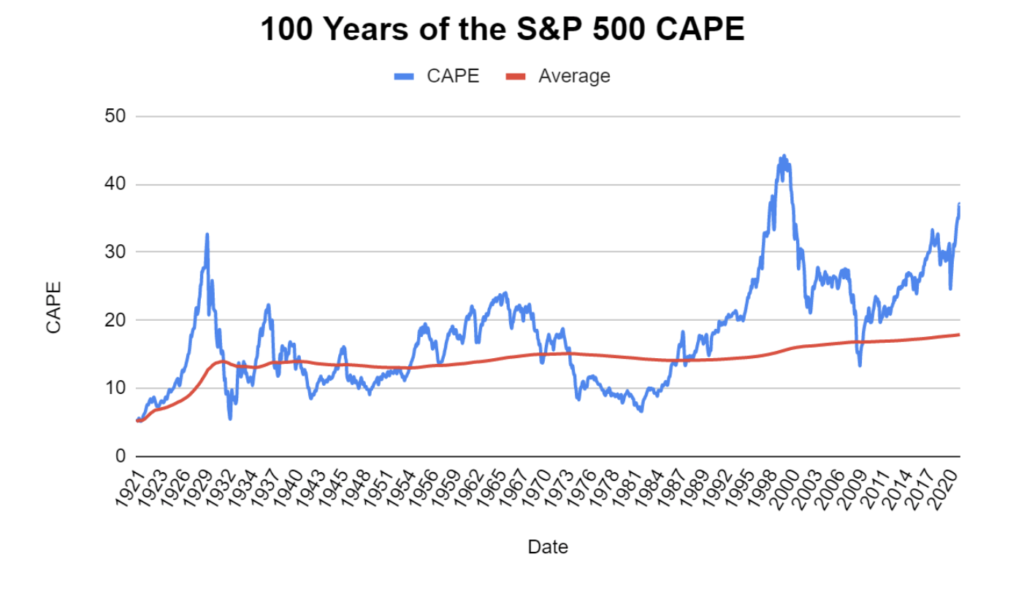
At the time of writing the S&P 500 is just below 4,200, which is fractionally below its recently set all-time high. So, the price is high on a historical basis, but so is its valuation according to the CAPE ratio.
Valuing the S&P 500 using its CAPE ratio
If you’re not familiar with the cyclically adjusted PE ratio (CAPE) then here’s a quick summary.
When we value an index, we’re effectively trying to work out if the price is high or low compared to the index’s fair value, ie, the price a rational investor would pay to get their target rate of return.
So we’re trying to compare price to value.
Since nobody knows the true value of an index, we have to make an estimate based on conservative but realistic assumptions.
With the standard PE ratio we’re comparing price to earnings, so we’re using earnings as a proxy for value. If earnings go up then we assume value goes up too, and that’s a reasonable assumption.
But PE only looks at last year’s earnings and earnings in a single year can be very volatile. Intrinsic or fair value, on the other hand, usually isn’t volatile.
For example, if Tesco earns zero profit in a year, it wouldn’t be reasonable to say that Tesco’s fair value was zero.
Obviously the S&P 500’s earnings are more stable than most companies’ and they probably won’t go to zero anytime soon, but they’re still somewhat volatile as the chart below shows.
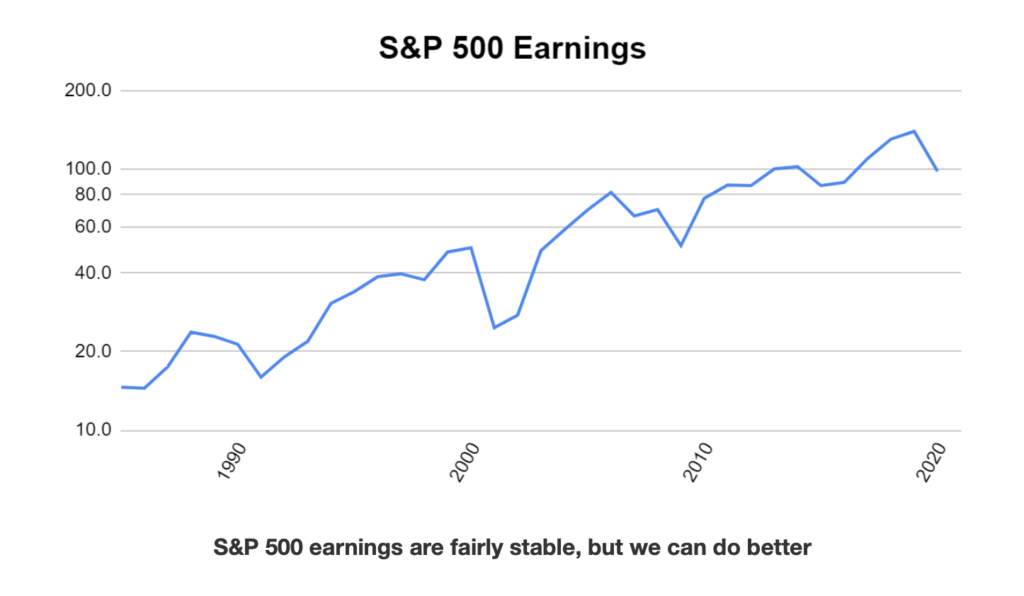
By cyclically adjusting earnings (using their inflation adjusted 10-year average) we get something that’s more stable and more closely related to the fair or intrinsic value of these 500 companies: