


In 2005, futurist Ray Kurzweil shocked the world with his book, The Singularity is Near. He speculated that around the year 2045, the Singularity, which is to say a humanity which has merged with technology, will turn artificial intelligence (AI) into pure energy and saturate the universe at, or beyond, the speed of light. Central bankers, for their part, have been working on a parallel project: to use imaginary intelligence (II) to collapse all financial asset prices onto each other to create a single composite price series and saturate the financial universe. Their actions, intentionally or otherwise, have at times raised the correlation coefficients between the prices of different financial assets to extraordinary heights, if not quite 100%.
Appropriately for the season of Epiphany, when wise men followed a star, there is one chart that has captivated the attention of wise and not-so-wise men and women in these early days of 2018. It is the time series chart of the yield on 10-year US Treasuries (figure 1). In this chart is captured, for economists, financial analysis, and asset managers alike, ‘the hopes and fears of all the years’.
Figure 1
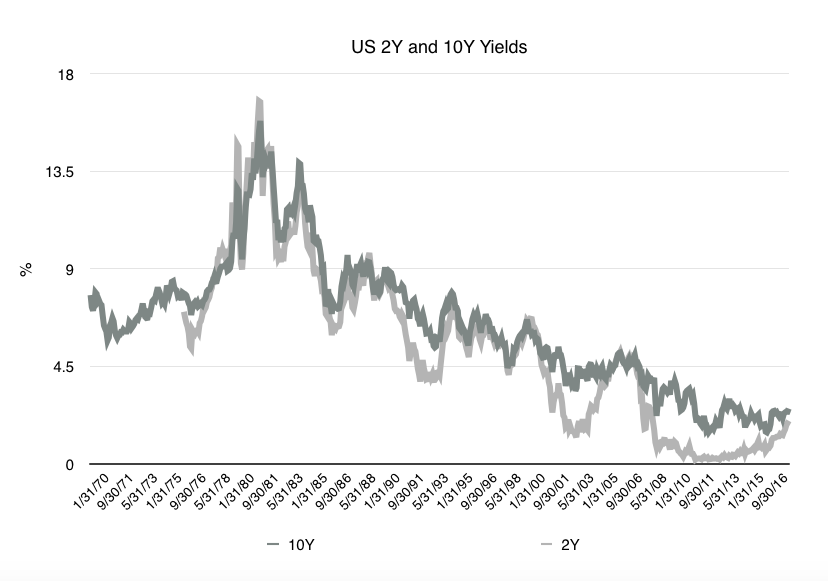
Source: Reuters Eikon Datastream
Allow me to explain. At the end of the chaotic and inflationary 1970s, western governments finally decided to attempt to restore order to their domestic financial affairs. Having long relied on the US to provide leadership in economic and financial management – imported via a fixed exchange rate to the US dollar, until Bretton Woods fell apart in 1971 – the developed nations of Europe and Asia realised that they must now assume this responsibility themselves. The US itself needed the harsh discipline of monetary restraint, administered by one Paul Volcker. This meant the taming of government budget deficits and of periodic adventurism by domestic banks.