


In recent weeks the debate about the significance of the flattening yield curve has reached fever pitch. Does a flat curve spell curtains for the US/UK economic expansion – and by extension, the global economic expansion? Can we hear the distant strains of the amply upholstered diva? Is this a golden moment to acquire bargain basement long-dated bonds?
My answer is no, no, thrice no! We have insufficient evidence that global economic momentum is faltering, especially in the light of the latest US national accounts data and the stimulatory policy announcements from China. As I argued in a previous article, past relationships suggest that US bond yields have further to rise to adjust to a strengthening nominal environment. Part of that is compensation for faster inflation, and part reflects an improvement in real economic growth. It would be quite extraordinary for an economic expansion to end with real interest rates – short and long – little above zero. The typical real interest rate achieved at the end of a post-war US tightening cycle has been 2, 3 or even 4 per cent. How can we be sure that US real interest rates – short and long – will not revisit positive territory before this economic expansion ends?
The alternative scenario, which we favour, is that the entire US yield curve has further to travel to adjust to an environment of 6 per cent to 7 percent nominal GDP growth. Not only could the FOMC extend its planned normalisation, in the light of positive economic surprises, but bond yields could create the room for that normalisation to occur in the context of an upward sloping curve. (Just imagine the Trump tweets that would ensue). As a bond investor, how would you wish to be positioned in the long-dated Treasury futures market if you entertained this suspicion? Or if you took the New York Fed’s underlying inflation gauge (figure 1) seriously? Or the Atlanta Fed’s wage tracker?
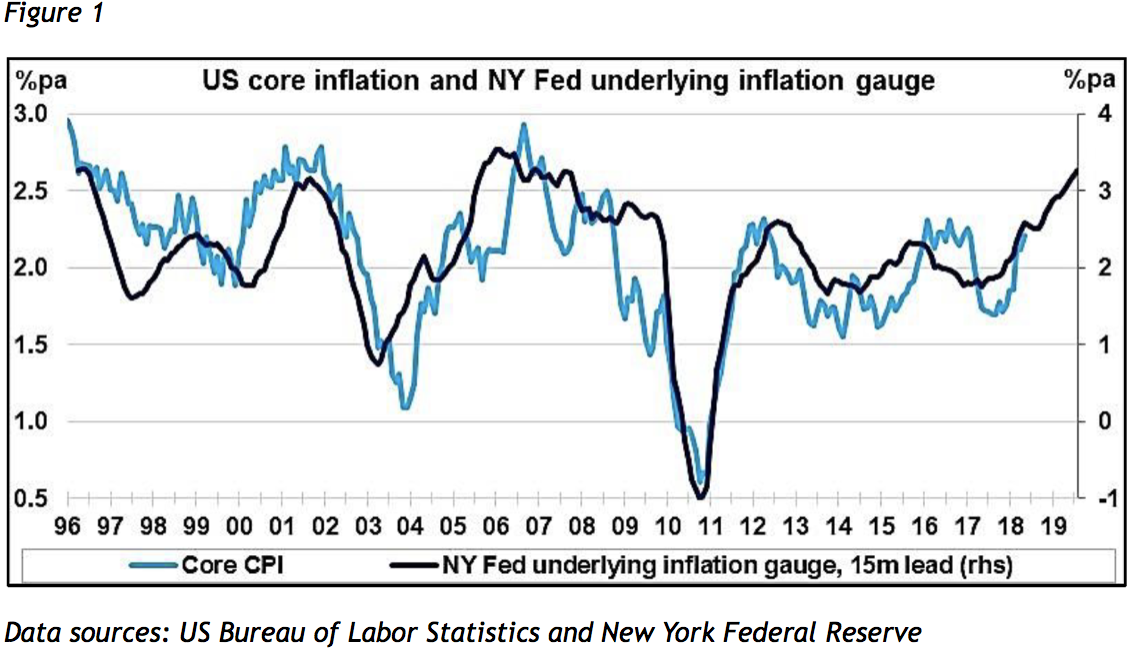
Figure 2 provides a rough-and-ready answer. Aggregate net positioning, in terms of numbers of contracts, has never been as negative as it is today, with these positions concentrated in the longer maturities. Tariff talk has diverted financial market attention from the here and now. Flatter yield curve natter has obscured the longer-term perspective on the determination of long bond yields and exposed bond investors – and property investors – to the risk of significant capital loss over the coming year.