


If you’ve seen the film Forrest Gump, you’ll probably recall that the central character ends up the multi-millionaire owner of a shrimp-fishing business and an investor in the nascent Apple computer company (I hope he held on to those shares!). And all with an IQ of just 75.
To what extent does income relate to intelligence in the real world? Or, at least, how does it relate to the best proxy we have for intelligence: level of education? We thought it would be interesting to explore this question, particularly as we are adding education and income data into version 2 of the REalyse platform.
Degrees of separation
Taking the County Durham town of Hartlepool as a random example, we can see in the below graph that there is a clear positive relationship between the level of education (as measured by the percentage of the population in each ward with a university degree) and weekly income.
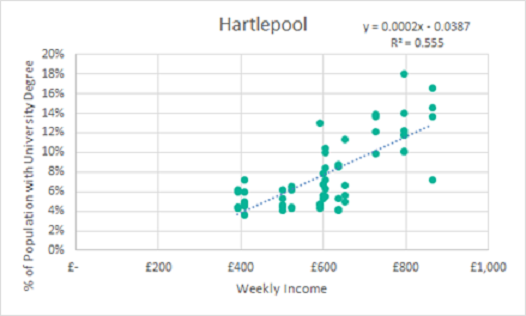
The trend line shows that for every 1% increase in the number of people with a university degree, there is a corresponding £50 increase in average weekly income.
Hartlepool house prices
Lining up weekly income with house prices in Hartlepool shows a tighter relationship (nb There are fewer matches in the below graph because we are comparing Middle Layer Super Output areas [MSOAs] as opposed to wards, of which there are more.)
Here it seems that for each £50 increase in weekly income (£2,600 per year), there is a corresponding £10,000 increase in house price. This makes sense if we apply a typical 75% loan-to-value (LTV) to purchases. Each additional £2,600 of individual purchasing power (net of tax) would equate to £10,400 in leveraged purchasing power.