


FTSE ST Real Estate Investment Trusts (FTSE ST REIT Index) has increased from 767.98 to 783.05 (+1.96%) compared to my last post on Singapore REIT Fundamental Comparison Table on 5 November 2018.
Currently the index is trading in a downward trend channel after finding a short term support at around 760. This support has been tested on four occasions since mid October. Currently, the REIT index moves above the 20D and 50D SMA indicating short term bullishness. There may be a chance the REIT index enters into a sideways consolidation mode based on the chart pattern.
Based on the current chart pattern and trend analysis, the trend for the Singapore REIT direction is SIDEWAYS to DOWN! The REIT index will be capped by the immediate resistance at about 800 which is the 200D SMA resistance and also the round number.
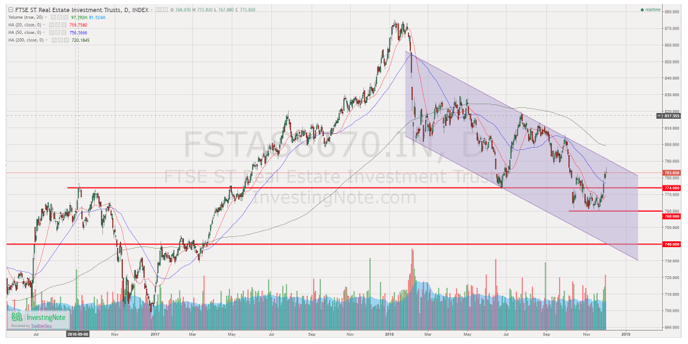
Chart 1: FTSE ST REIT Index (FSTAS8670)
Fundamental Analysis of 39 Singapore REITs
Table 2 is a compilation of 39 REITs in Singapore as of November 2018, with colour coding of the Distribution Yield, Gearing Ratio and Price to NAV Ratio. This gives investors a quick glance as to which REITs are attractive enough to have an in-depth analysis.
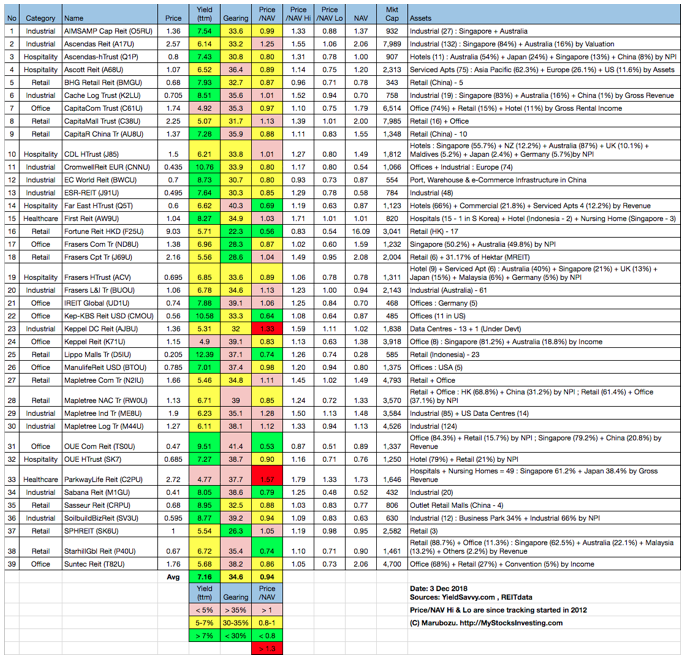
Table 2: Singapore REIT Fundamental Comparison Table December 2018
Summary of Singapore REITs Table (December 2018) compared to November 2018 Singapore REITs Table: