


Real Estate Physical Market Cycle Analysis – 5 Property Types – 54 Metropolitan Statistical Areas (MSAs).
It appears mid-term elections should not substantially change the pro-growth policies being pursued by the current administration, thus moderate economic growth should continue for the next few years. While US GDP growth has trended above the 2% average experienced since the great recession, slowing growth in Germany China and Japan may moderate US growth in the future. Full employment may push inflation and interest rates moderately over the next year. Demand growth continues in all the property types, with mild oversupply in apartments and hotels. We expect slowing supply growth due to labor shortages and higher construction costs.
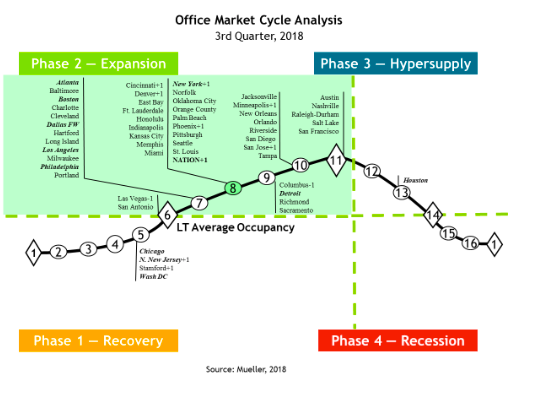
Office occupancy increased 0.1% in 3Q18, and rents grew 0.5% for the quarter and 2.2% annually.
Industrial occupancy was flat in 3Q18, and rents grew 1.2% for the quarter and 5.9% annually.
Apartment occupancy increased 0.1% in 3Q18, and rents grew 0.2% for the quarter and 3.2% annually.
Retail occupancy was flat in 3Q18, and rents grew 0.2% for the quarter and 1.6% annually.
Hotel occupancy declined 0.2% in 3Q18, and room rates grew 0.8% for the quarter and 3.3% annually.
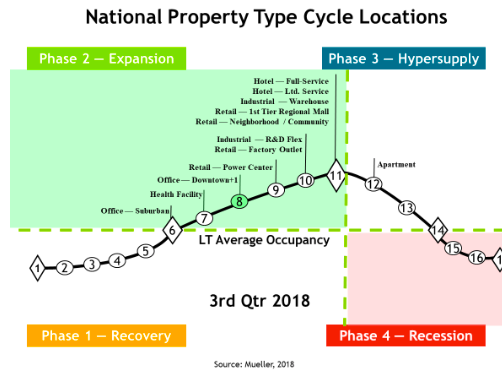
The National Property Type Cycle Locations graph shows relative positions of the sub-property types.
Glenn R. Mueller, Ph.D. – Professor, Burns School of Real Estate & Construction Management – glenn.mueller@du.edu University of Denver – https://daniels.du.edu/burns-school.
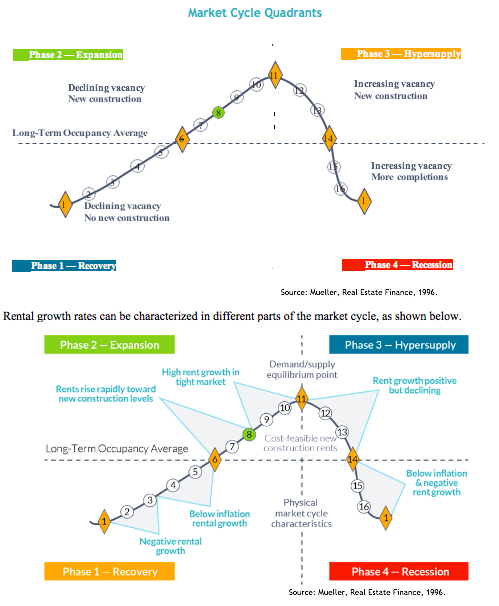
The cycle monitor analyzes occupancy movements in five property types in 54 MSAs. Market cycle analysis should enhance investment-decision capabilities for investors and operators. The five property type cycle charts summarize almost 300 individual models that analyze occupancy levels and rental growth rates to provide the foundation for long-term investment success. Commercial real estate markets are cyclical due to the lagged relationship between demand and supply for physical space. The long-term occupancy average is different for each market and each property type. Long-term occupancy average is a key factor in determining rental growth rates — a key factor that affects commercial real estate income and thus returns.
Office
The national office market occupancy level increased 0.1% in 3Q18 and was up 0.1% year-over-year. Office employment growth was constrained by full employment, as firms found it difficult to hire from a smaller hiring pool. New supply is moderate, as higher construction and financing costs are creating better rationalization. Short term rentals like WeWorks is leading new demand for space as small start-ups need the growth flexibility and larger firms realize that the tax code now favors short terms rentals that do not have to be accounted for as debt on their balance sheets like long term leases. National average occupancy has moved to point #8 (the cost feasible rent level) so expect more new construction. All but five markets are now in the growth phase of the occupancy cycle! Average national rents increased 0.5% in 3Q18 and produced a 2.2% increase year-over-year.