


The FTSE ST Real Estate Investment Trusts (FTSE ST REITs Index) continued its bullish rally, raising from 832.03 to 842.91 (+1.31%) as compared to my last post on Singapore REIT Fundamental Comparison Table on Feb 4, 2019.
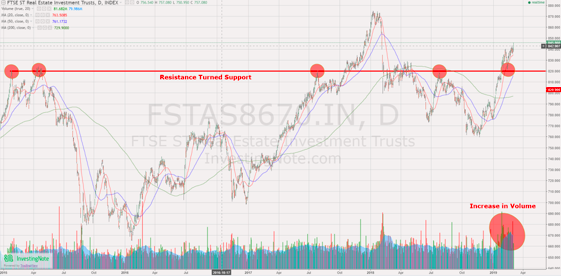
Chart 1: FTSE ST REIT Index (FSTAS8670)
The REITs index retraced and successfully tested the 820 resistance-turned-support to continue the uptrend. In addition, this bullish uptrend is supported by a strong volume. Based on the current chart pattern and trend analysis, the trend for Singapore REITs is up! There is a chance for the Singapore REITs index to test the immediate resistance at about 875 (the previous high in 2018) based on current market sentiment and bullish momentum. This represents another 4% upside potential from the current level before the REITs index can reach a new high. All eyes will be on whether the Singapore REITs can break the all time high of around 890 back in May 2016.
Fundamental Analysis of 39 Singapore REITs