


On the surface, single tenant real estate is the most straightforward asset class out there.
As the name implies, each asset has a single tenant operating under one lease for the entire property with minimal landlord responsibilities. Underwrite the tenant and the lease, and you’ve underwritten the asset–more or less. With a long enough lease term, single tenant assets effectively trade as bonds tied to the tenant’s credit risk.
But complexity–and opportunity–arises as single tenant leases approach the end of their term. While urban or general-purpose retail assets can be easily re-purposed, others cannot, so the value of the asset varies wildly depending on the probability of renewal. A Dollar General store in a rural market, for instance, is worth far less if Dollar General chooses not to renew.
This kind of binary renewal outcome tends to spook smaller and less sophisticated investors, creating an opportunity to purchase quality single-tenant assets for deep discounts–at least if the renewal decision can be predicted with some degree of accuracy.
Fortunately, data and machine learning are making those outcomes more predictable than they’ve ever been. Today’s letter will explore the evolution of the single tenant market, specifically:
- The factors that influence single tenant renewal.
- Data sources and how prediction algorithms are giving sophisticated investors an edge.
- Likely impacts on the single tenant real estate market.
It hardly needs to be pointed out that a commercial real estate acquisition can be a complicated affair, and that evaluating CRE opportunities is far from simple. But retail net lease deals would appear to be an exception. With minimal landlord responsibilities and a tenant often already in place, there are considerably fewer unknowns than other CRE asset classes. Sure, some assessment of the tenant’s credit risk is needed, and projections regarding the owner’s share of operating expenses and future cost of capital are in order. But estimates of those unknowns are by and large widely available and related to the “macro” state of the economy or a given retailer. No wonder the triple net lease is often termed a “coupon cutter” investment.
But the appearance of simplicity can be misleading. When dealing with a retail net lease that’s nearing expiration–especially for a store in a secondary or tertiary market–underwriting is much trickier. A major question mark often looming over such a transaction is whether the current tenant will renew their lease; a related question mark is who will take their place if they don’t. Getting the right answers can easily be the difference between boom and bust.
Answering those questions is very different from the sort of real estate forecasting that’s commonly done by economists and finance professionals. Their predictions are almost always coarse-grained, being at the level of the market or chain. They are projecting things like probability of corporate default, interest rate movements, and area unemployment. Projecting whether the current retail tenant will stay, and if not who’s likely to take their place, is much more fine-grained. We need to predict whether specific property-tenant pairs are good matches. It’s no wonder, then, that precise predictions of this sort are hard to come by.
Of course, real estate analysts do try to come up with their own predictions of tenant renewal. When underwriting a deal that has an impending lease end date, one has to pencil in some renewal likelihood, and one needs some sense of which retailers could backfill the space if it goes dark. And the past few years have witnessed an explosion in the amount and variety of high-quality relevant data available. Analysts these days can gather all sorts of historical and current data on the property, including:
- foot traffic to the location
- the property’s “trade area” and the trade areas of nearby competitors
- reported sales – and when sales aren’t reported, sales estimates based on credit card transactions
- area demographics and income (in a hyper granular way)
- local crime stats
- drive times to and from local residential and industrial areas
- building permits for the surrounding areas
- customer ratings and reviews
…and on and on.
All this information is now available at the click of a button, or several buttons (depending on whether one is paying a “data aggregator” who’s bringing together multiple data sources). The challenge created by this explosion of data is figuring out how to extract bottom-line insights from this dizzying array. In a word, what’s an analyst supposed to do with all the data after she’s gathered it?
Take a concrete case:
Jill the analyst is looking at an on-market Dollar General in Ohio. It’s got 3 years left on the lease, rent/sqft is in line with the local leasing market, it has a renewal option with a 10% increase, and an attractive asking cap rate. Jill is tasked with figuring out how likely it is that Dollar General will stick around, and so she looks into the additional data.
It’s a “mixed bag”: foot traffic/sqft puts it in the 25th percentile nationwide, but 55th percentile in the state. Estimated sales are up from 3 years ago, but down since last year. The average local income seems intuitively to match up with a “Dollar General customer profile”, but the overall population has seen a slight decrease over the past 5 years, and there’s a relatively small population of middle-aged folks. There’s a Dollar Tree down the road, and a Walmart 6 miles away, but there’s no Dollar General within 7 miles.
The store size is 9,100 square feet, i.e. one of their newer prototypes, but not the newest. There were a few robberies recently 2.2 miles away.
In summary: there’s a lot to go on, but very little clarity about which way to go. Given all of these stats, what is Dollar General likely to do when the lease comes up? How hard are they going to push on the lease renegotiation? How should all of these factors be aggregated into a single, bottom-line assessment?
Jill probably has her well-honed intuitions about which factors matter most, what foot traffic percentile is good enough for Dollar General, how close to the nearest Walmart is too close for comfort, how big the middle-aged population must be, and so on. But she’s never tested those intuitions. And not only are there many factors to take account of, but there are also intricate interactions between the factors. The foot traffic might be good enough for Dollar General to stay given the nearby competition but wouldn’t have been so otherwise. The demographic makeup might not be right given that the store is in the Midwest, but it would be just fine in Alabama. How is the analyst supposed to know?
Sure, there are cases in which the signals all point in the same direction, but those cases are very few and far between, and they’re almost never going to present opportunities for real alpha. It’s no wonder then that despite working with more data than ever and spending weeks poring over all of it, analysts are still left very uncertain about their decisions and reliant on guesswork…
But they don’t have to end up that way. The past few years have witnessed not just a data explosion, but a parallel rapid advance in the machine learning tools available to extract actionable insights and predictions from large datasets. Given these tools, and the data, the analyst’s questions can now be answered rigorously, confidently, and instantaneously. It’s now possible to play Moneyball with net lease real estate.
The key is to keep one’s “eye on the ball”, while zooming out from the particular location one wants to analyse.
If Jill wants to answer whether Dollar General will stick around at this location, she can’t just look at the data on this particular location. Nor should she necessarily be looking at all the data on that location. That’s a recipe for getting lost–and losing sight of the ball. She needs a model that can understand and predict Dollar General’s leasing behaviour in general. She needs to learn from all of Dollar General’s historical opening and closing decisions about what makes them “tick” from a real estate point of view. Which of the myriad factors matter to Dollar General in their decisions about staying vs. leaving, what are their “sweet spot” values for things like size and median income, and how do all these factors interact with each other to issue in a bottom-line corporate real estate decision?
Dollar General, like very many retailers, has wittingly or (more likely) unwittingly been sending out behavioural signals for quite some time. Every time they decide to renew a lease, or vacate and move down the block, or close and leave a neighbourhood, they’re sending a signal about where they want to be, and where they don’t want to be. The data on where they have opened and closed over the past decade is now accessible, just like all the predictive factors already mentioned.
Given all of this data, and the machine learning tools, we can let the machines learn what variables matter to Dollar General, how much they matter, and which values of those variables are positive, neutral, and negative as far as Dollar General is concerned. Sweet spots? Complex interactions between features? That’s no problem!
Data scientists are no longer using (just) your grandmother’s linear regressors. With the latest algorithms it’s now possible to capture extraordinarily intricate connections between features and interactions between locations. (Some of these tools have actually been around for a while, but have recently skyrocketed in popularity, others have only recently overcome technical hurdles and are now extremely powerful.) The result is exactly what Jill was looking for. And not just for that location in Ohio, but for every Dollar General location (and any other retailer she might care to model!)
She can understand what’s important to Dollar General about each and every one of their locations–and whether the store is doing well or poorly in all those important ways–together with a bottom-line probability that it’ll still be there when the lease is up. No more pencilling that in by hand; no more weeks of work on a single store; no more guestimates that leave her feeling unsure. It’s like precision medicine, but for real estate.
Of course, the model’s predictions are only as valuable as the accuracy and reliability of the model. But that–unlike the reliability of a case-by-case reliance on intuition–can be systematically tested. In the hands of able data scientists, models can be developed that are extremely well calibrated. What that means, roughly, is that if you take all the stores that the model assigned a 10% chance of closing (within some specified period), around 10% of them in fact closed; for those that the model assigned a 20% chance of closing, around 20% in fact closed; and so on. Here, for example, is a calibration curve that’s achievable for major restaurant chains:
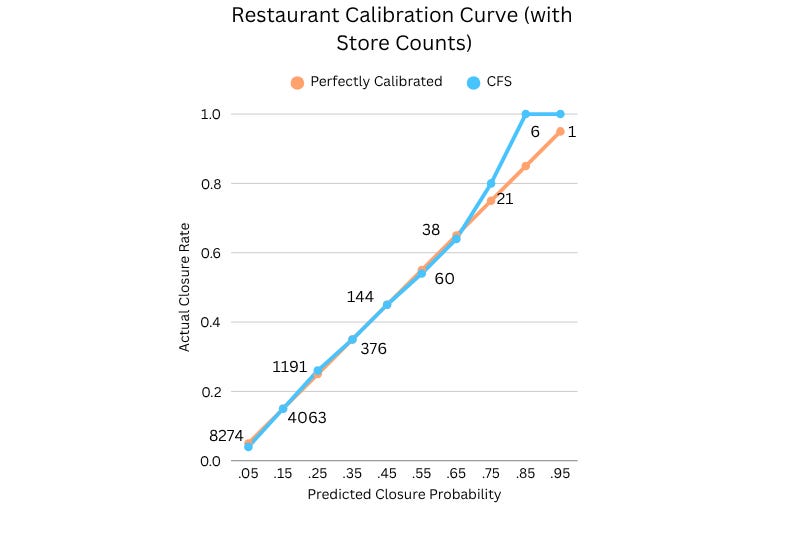
As one can see, there’s very little deviation from the perfectly calibrated line. (A perfectly calibrated model is achievable only in Plato’s Heaven, not in the real world.) Someone relying on this model to predict a 12% likelihood that some, particularly Arby’s location will be closing can be quite confident that that’s in fact the likelihood.
There’s an understandable apprehension surrounding the adoption of many AI/ML technologies, given the feeling that the machine is often a “black box”. The results feel like Willy Wonka’s Everlasting Gobstoppers: they do well in tests, but we humans haven’t a clue of what’s going on with them.
But while that uneasiness is sensible when it comes to certain kinds of AI, it isn’t equally sensible across the board. And the models that can be developed to predict tenant behaviour are very far from a black box. These models are not just predictive but explanatory, and explanatory at a hyperlocal level. Using SHAP values (and other measures of feature importance) one can understand exactly what it is about the location that’s driving the prediction–which of the thousands of features that the model is seeing matters, how much, and in which “direction”.
For an investor on the lookout for mispriced assets these tools can be a gold mine. One can confidently buy a Dollar General in a rural area, highly discounted because there are only 2 years left on the lease and the foot traffic data is middling and everyone else is nervous about whether it’s going to renew–but where the machines have figured out that there’s a 99% chance it will. It’s what the Billy Beane of real estate would do.
And using these models to underwrite acquisitions is really just the beginning. Any landlord entering a lease negotiation with a retail tenant should be armed with an accurate sense of how much the tenant wants to stay there, and with an understanding of which other tenants would want to be there instead; any fund with a substantial portfolio needs some way of monitoring their properties and raising red flags about NOI at risk; retailers would be well served by precise insights into their competitors’ real estate strategies; and it’s simply a must for any CMBS lender who needs to efficiently evaluate a large number of retail leases.
The data is available. The machine learning tools are here. It’s about time they are brought together.
This article was originally published by Thesis Driven.


