


So far, in my previous articles, I have introduced the 3 most important financial ratios for analysing and shortlisting REITs, and also the FTSE ST REIT index to gauge the Singapore REITs market sentiment. Moving forward, I will give an overall market update starting with the FTSE ST REITs index and then moving onto the Singapore REITs table.
Technical Analysis of FTSE ST REIT Index
The FTSE ST Real Estate Investment Trusts (FTSE ST REIT Index) decreased slightly from 808.04 to 802.97 (-0.63%) as compared to my last article on The Singapore REIT Fundamental Comparison Table on Sept 2, 2018. The REIT index continues to trade within a tight range between 800 and 820 and is currently forming a Symmetrical Triangle (a medium term consolidation chart pattern).
There are two chart patterns observed in this FTSE ST REIT Index. A Head and Shoulders pattern is a trend reversal pattern, this is a bearish pattern. The symmetrical triangle is a consolidation pattern, i.e. moving sideways. Thus, the short to medium term Singapore REIT direction is: Sideways to down.
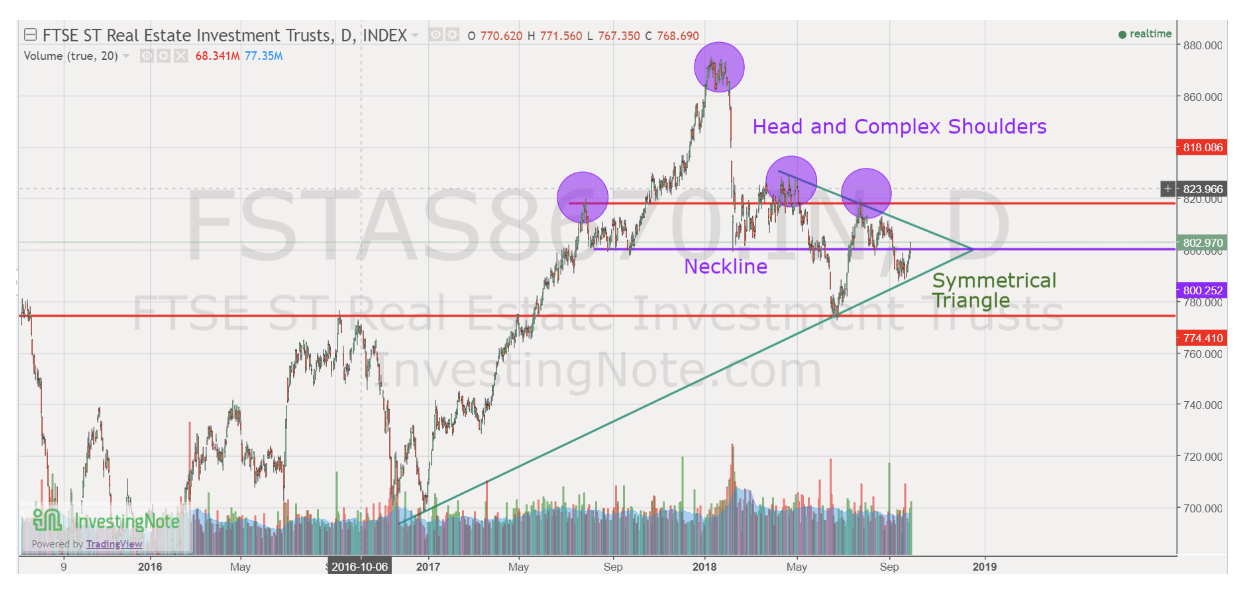
Chart 1: FTSE ST REIT Index
Fundamental Analysis of 40 Singapore REITs
Table 2 is the compilation of 40 REITs in Singapore as of Oct 2018 with colour coding of the Distribution Yield, Gearing Ratio and Price to NAV Ratio. This gives investors a quick way to see which REITs are attractive enough to have an in-depth analysis.
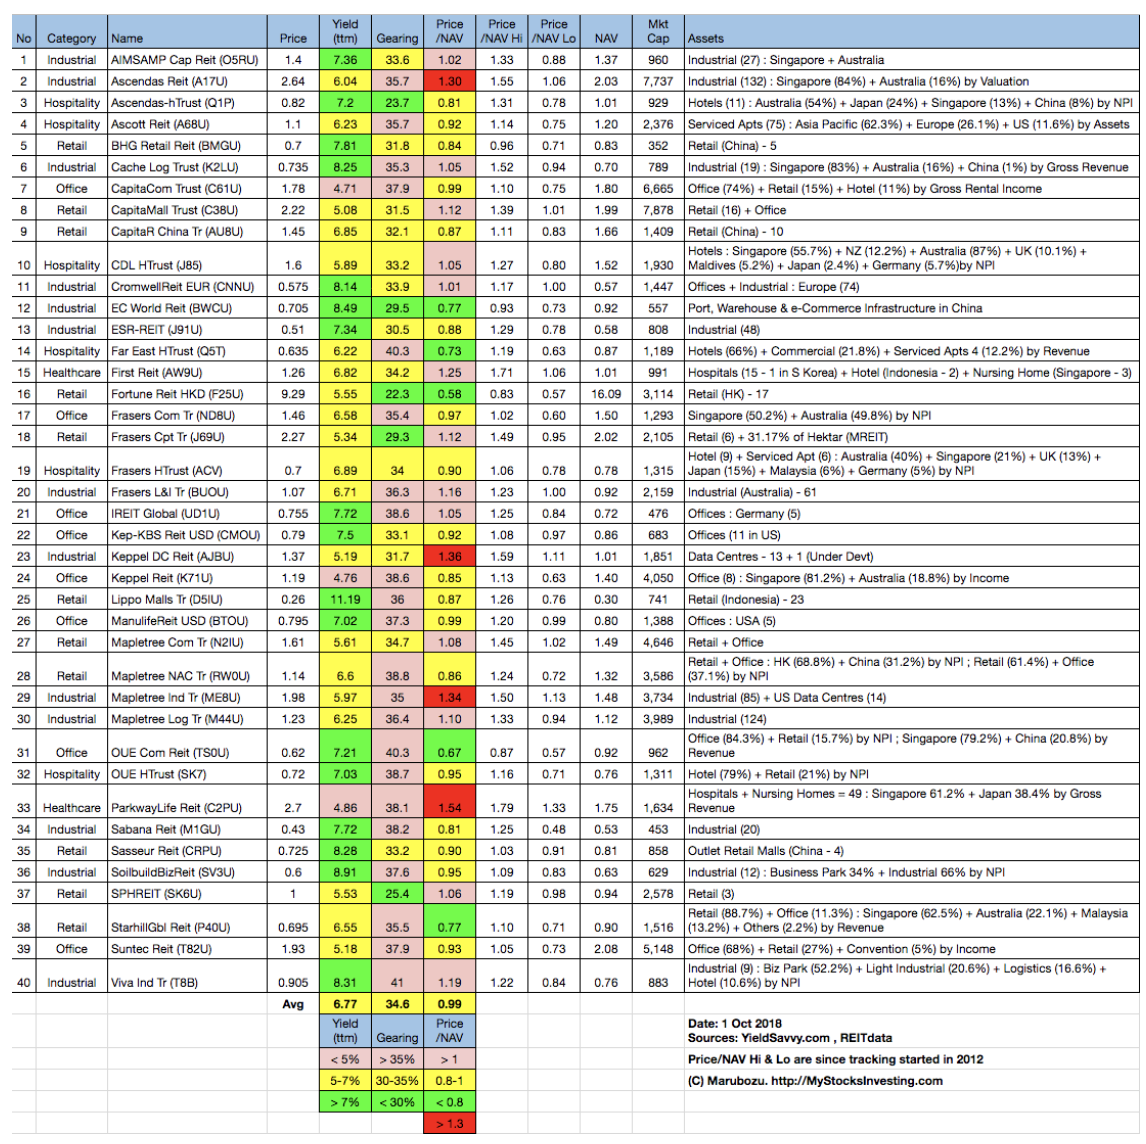
Table 2: Singapore REITs Fundamental Comparison Table Oct-2018
Summary of Singapore REITs Table (Oct-2018) compared to Sept 2018 Singapore REITs Table
- Price/NAV has decreased from to 1.00 to 0.99 (Singapore Overall REIT sector is slightly under value now).
- Distribution Yield increases from 6.67% to 6.77% (take note that this is lagging number). About one third of Singapore REITs (17 out of 40) have Distribution Yield > 7%.
- Gearing Ratio stays at 34.6%. 22 out of 40 have a Gearing Ratio of more than 35%. In general, Singapore REITs sector gearing ratio is healthy.
- The most overvalued REIT is Parkway Life REIT (Price/NAV = 1.54), followed by Keppel DC REIT (Price/NAV = 1.36), Ascendas REIT (Price/NAV = 1.30) and Mapletree Industrial Trust (Price/NAV = 1.34).
- The most undervalued (based on NAV) is Fortune REIT (Price/NAV = 0.58), followed by Starhill Global REIT (Price/NAV = 0.77), Far East Hospitality Trust (Price/NAV = 0.73), OUE Comm REIT (Price/NAV = 0.67) and EC World REIT (Price/NAV = 0.77).
- Highest Distribution Yield (TTM) is Lippo Mall Indonesia Retail Trust (11.19%), followed by SoilBuild BizREIT (8.91%), Viva Industrial Trust (8.31%), Cromwell European REIT (8.14%), EC World REIT (8.49%), Sasseur REIT (8.28%) and Cache Logistic Trust (8.25%).
- Highest Gearing Ratio are Viva Industrial Trust (41%), Far East Hospitality Trust (40.3%) and OUE Comm REIT (40.3%).
Interest Rate Hike Impact on FTSE ST REIT Index
The US Fed has increased the interest rate to 2.25% on Sept 26, 2018. There is no knee jerk reaction to this because the FTSE ST REIT index has already priced in a rate hike.
Based on previous chart pattern, the FTSE ST REIT index sold off 2-3 months in advance before the actual announcement of rate hike. This can be seen in the rate hike to 0.75% on Dec 2016 and rate hike to 1.75% on Mar 2018.
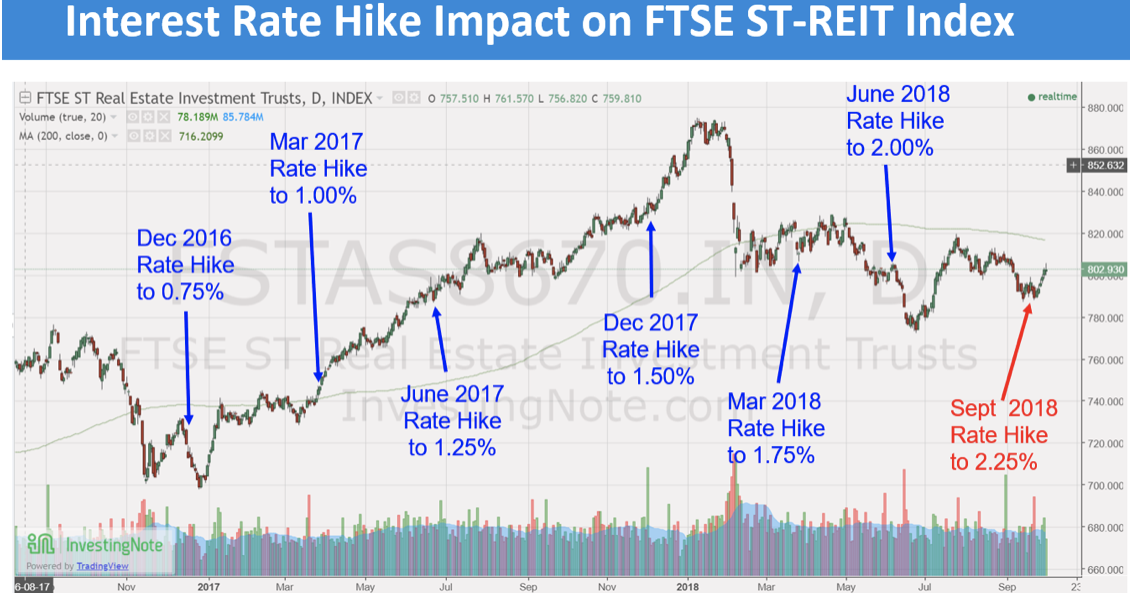
Chart 3: FTSE ST REIT Index Performance due to Interest Rate Hike
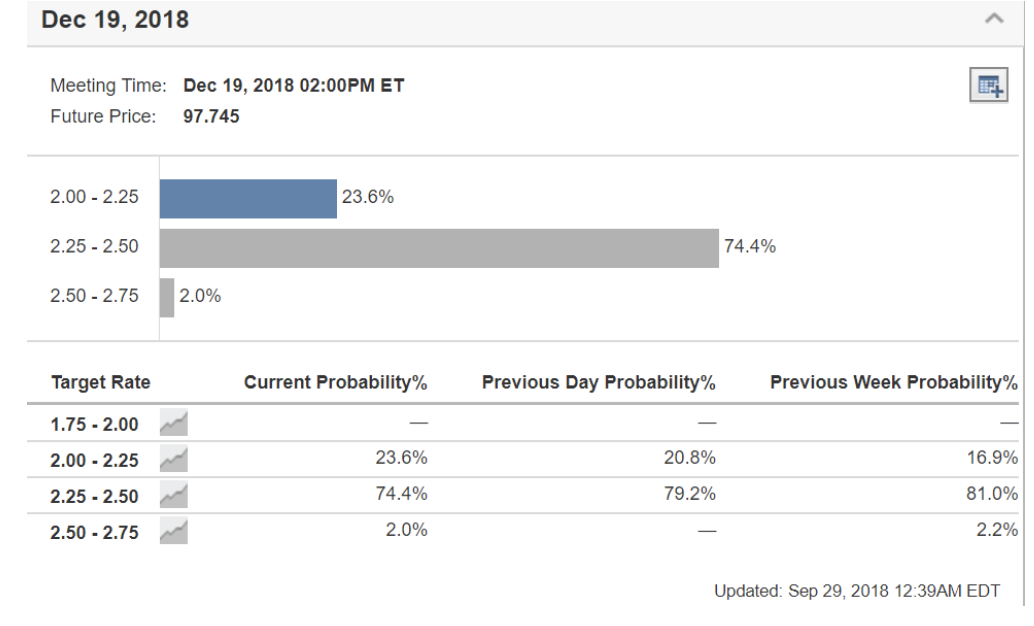
The next one to watch is a rate hike in December 2018. The current probability of an interest rate hike to 2.5% is 74.4% – see the Fed Rate Monitor Tool on Investing.com. If the Singapore REIT sector is sensitive to an interest rate hike to 2.5%, the selloff may start in the month of October and November. Elsewhere, the REIT index may continue to move sideway until end of the year.
Summary
Fundamentally, as a whole the Singapore REIT sector is slightly under value now. The overall yield for Singapore REITs is getting more attractive (with an average yield of 6.77%). Yield spread (with reference to 10-year Singapore government bonds) has compressed to 4.238% (compared to previous month of 4.29%). DPU yield for a number of small and medium market cap REITs are quite attractive (>7%) at the moment. However, technically, the REITs index is forming a Head and Shoulder trend reversal chart pattern, and currently trading sideways in a symmetrical triangle pattern waiting for the breakout. Further downside is expected if the 800 support level is broken. Small and medium cap REITs have reached an attractive entry level and investors could do some selective shopping now. The share price of Singapore REITs with bigger market capitalisation like Ascendas REIT, Capitaland Mall Trust, Suntec REIT, Mapletree Industrial Trust are all holding pretty well at the moment. In other words, investors still have to wait patiently for the price of these REITs to drop further to an attractive valuation and distribution yield.


