


UK average house prices have risen by over 160% in real terms since the middle of 1996. Home ownership remains around its lowest level for a generation. Among political leaders, policymakers and commentators there is a broad consensus that these problems are largely down to one failing: decades of undersupply of housing.
But the housing shortage story is unconvincing. Official data on housing volumes and the day-to-day cost of putting a roof over one’s head suggest that supply growth has been sufficient to restrain upward pressure on house prices. However, much more powerful countervailing forces have driven them to record multiples of income. This implies that the current policy focus on boosting supply does not offer a solution to the housing crisis and a fundamental rethink is badly needed.
Housing supply has outstripped household formation for decades
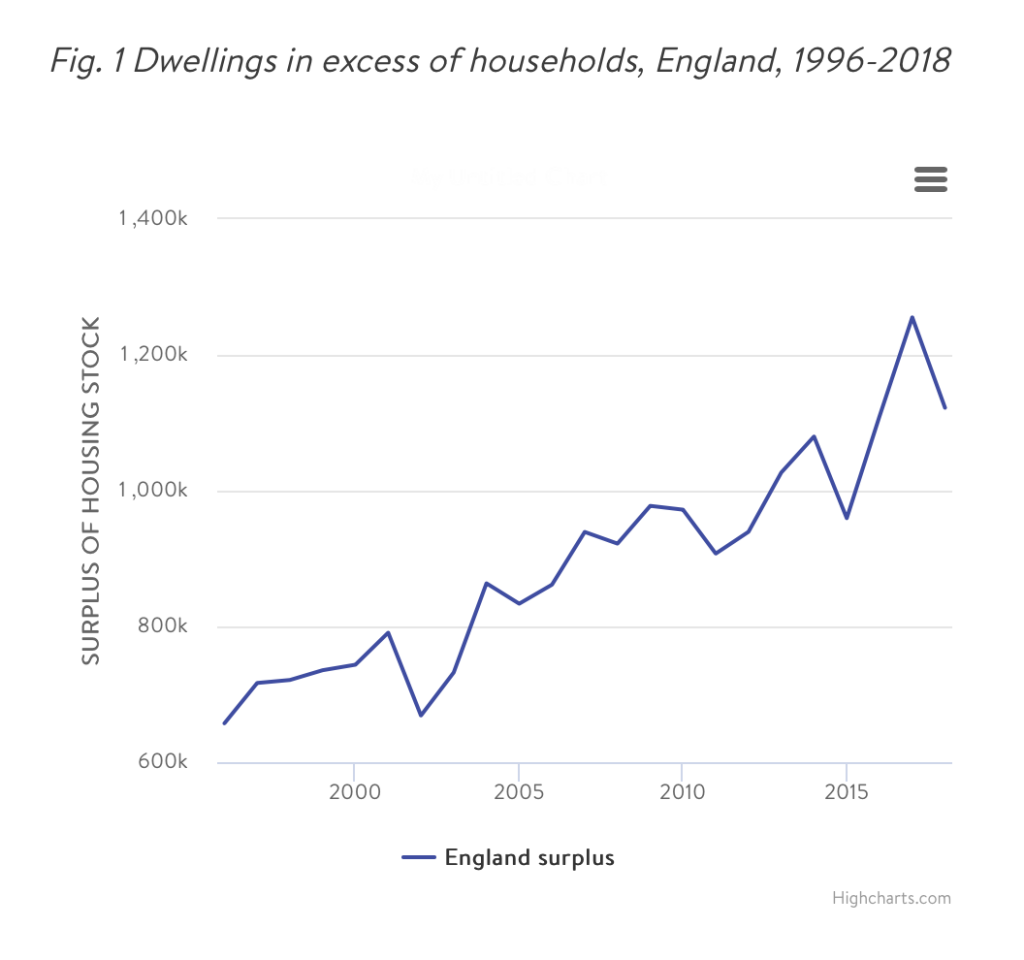
It is commonly claimed that we have failed to build enough houses to meet the demand for places to live. But official data suggest this is not the case: since the 1996 nadir of house prices, the English housing stock has grown by 168,000 units per year on average, while growth in the number of households has averaged 147,000 per year. As a result, while there were 660,000 more dwellings than households in England in 1996, this surplus has since grown to over 1.1 million by 2018 (see Fig. 1). Similar trends are apparent in Scotland and Wales. This story – based on the official count of dwelling stock and the Labour Force Survey – is also visible in the English Housing Survey and corroborated by alternative measures such as the growth in total residential floor space and bedrooms per head of population.
It’s possible that the growing surplus of houses nationally could obscure tighter supply at regional level. But here too, the available data suggest that even in London and the South East, the number of houses has grown faster than the household count.
These figures are often obscured as commentators tend to compare house building numbers with projections of household formation. Both elements of this comparison have been misleading. First, ‘net additions’ to the housing stock tend to be about 30% higher than the number of new build completions each year, so reliance on the latter understates housing supply. Second, household projections have for many years significantly overestimated the rate of household formation due to questionable assumptions in the official methodology. The Office for National Statistics (ONS) has recently taken action to address these, resulting in household projections that are now much closer to past trends. Had the ONS’s new methodology applied for the past decade we would be used to hearing housing need figures of around 160,000 per year, rather than the 250,000 number that appeared in the government’s 2017 housing white paper.
The affordability of day-to-day housing costs
Despite the benign picture on housing volumes, it’s important to consider the cost of housing since that affects the rate at which people form new households. Here it is essential to distinguish between the cost of housing services and the price of housing assets. The day-to-day cost of housing services is measured by national statistical agencies around the world by the market rent on a rented house or the equivalent ‘imputed rent’ on an owner-occupied house. This cost can move independently of the purchase price of houses.
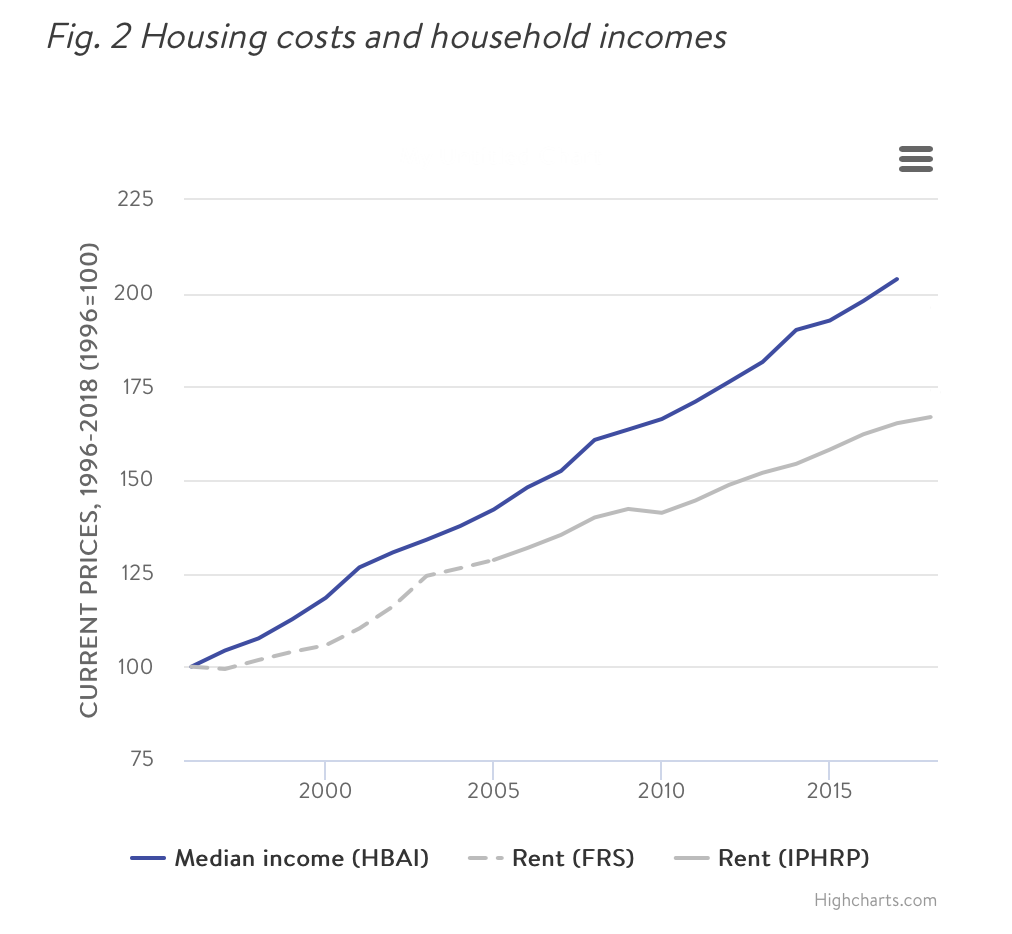
Any shortage of housing should therefore be reflected in rents and imputed rents rising faster than average household incomes. But ONS and Department for Work and Pensions (DWP) data show that rents have risen slower than median household incomes since 1996 (see Fig. 2). Consequently, affordability constraints on households have also eased, on average. Breaking the data down to the regional level shows a similar picture since 2005 (when a reliable regional rent index became available). In London, affordability has not worsened for the average household since 2005, and in all other regions rents have lagged household income growth. This is the opposite of what we would expect to see if housing supply had been inadequate and chimes with the evidence of a growing surplus housing stock.
What has caused prices to boom?
If not a shortage of housing, what lies behind the explosion in UK house prices from around 4.5 times median household income in 1996 to a multiple of around 8 today? The established theory of house price formation tells us that changes are determined by a combination of market rents and the cost of capital. So house prices can jump or crash in response to shifts in the main components of the cost of capital: mortgage interest rates, taxes, and expectations of future price growth. Such volatility can occur even when rents are stable.
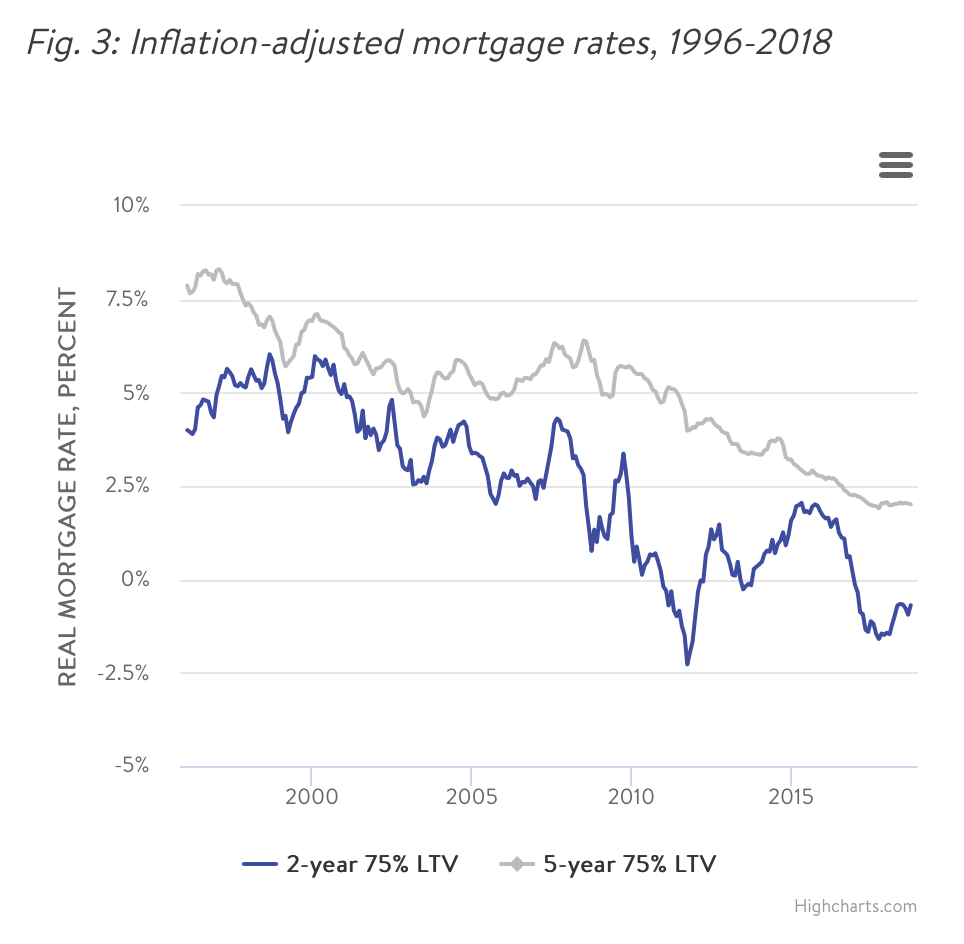
Since the late 1990s, mortgage rates have tumbled, with inflation-adjusted interest rates on five-year fixed-rate mortgages, for example, falling from 8% to around 2% today (see Fig. 3). Since mortgage interest rates tend to be the dominant element of the cost of capital for home owners, this change can be expected to precipitate a substantial increase in house prices of a similar magnitude to the 160% increase seen since 1996.
Credit availability is also a potentially important contributor to house price movements and several authors have highlighted the role of laxer credit conditions in the past, notably in the US in the run up to the financial crisis. However, in the UK most moves to deregulate the mortgage market had run their course by 1996. It is not obvious that a deterioration in lending standards is responsible for the price boom since then. Indeed the average loan-to-value (LTV) for first-time buyer (FTB) mortgages has fallen from 90% in 1996 to 83% on the eve of the financial crisis, and stood at a comparatively restrained 76% by the end of 2018. This suggests that changing economic fundamentals are the dominant part of the UK house price story since the late 1990s.
Below the national averages there has been a rapid divergence of prices among the nations and regions of the UK. London prices, in particular, have continued to grow strongly since the financial crisis and are almost 50% higher than their 2005 level in real terms. Meanwhile outside the Greater South East, prices are largely unchanged on 14 years ago. But the price boom in the Greater South East does not appear to be the result of an increase in the demand to live there: even London rents have grown by just 2% in real terms over the period, while those in the East and South East have slipped back. As a result, residential property yields have collapsed by a third in London over the past 14 years. The main driver of divergent prices around the country therefore appears to have been growing global demand for London (and potentially other major UK city) housing assets, but not growing demand from people to live there.
Nor is London’s story unique. The divergence of house prices in major global cities from their hinterlands is currently playing out in many countries around the world. Various analysts, including the IMF, have attributed this phenomenon to global investor demand that focuses on financially-integrated global cities.
How much would 300,000 net additions per year improve affordability?
The growth in house prices in the UK over the past 23 years does not appear to have been the result of inadequate supply, but could greater supply nonetheless be the solution? Hitting the government’s target of 300,000 houses per year would certainly put more downward pressure on prices and rents. But the available academic evidence suggests that no plausible rate of supply would significantly reverse the price growth of the past two decades.
Multiple modelling exercises, for the UK and elsewhere, find that a 1% increase in the stock of houses tends to lead to a decline in rents and prices of between 1.5% and 2%, all else equal. This implies that even building 300,000 houses per year in England would only cut house prices by something in the order of 10% over the course of 20 years. This is an order of magnitude smaller than the price rises of recent decades. If we are to create more affordable houses to buy and rent, the solutions lie elsewhere.
Explaining the growth in ‘hidden households’
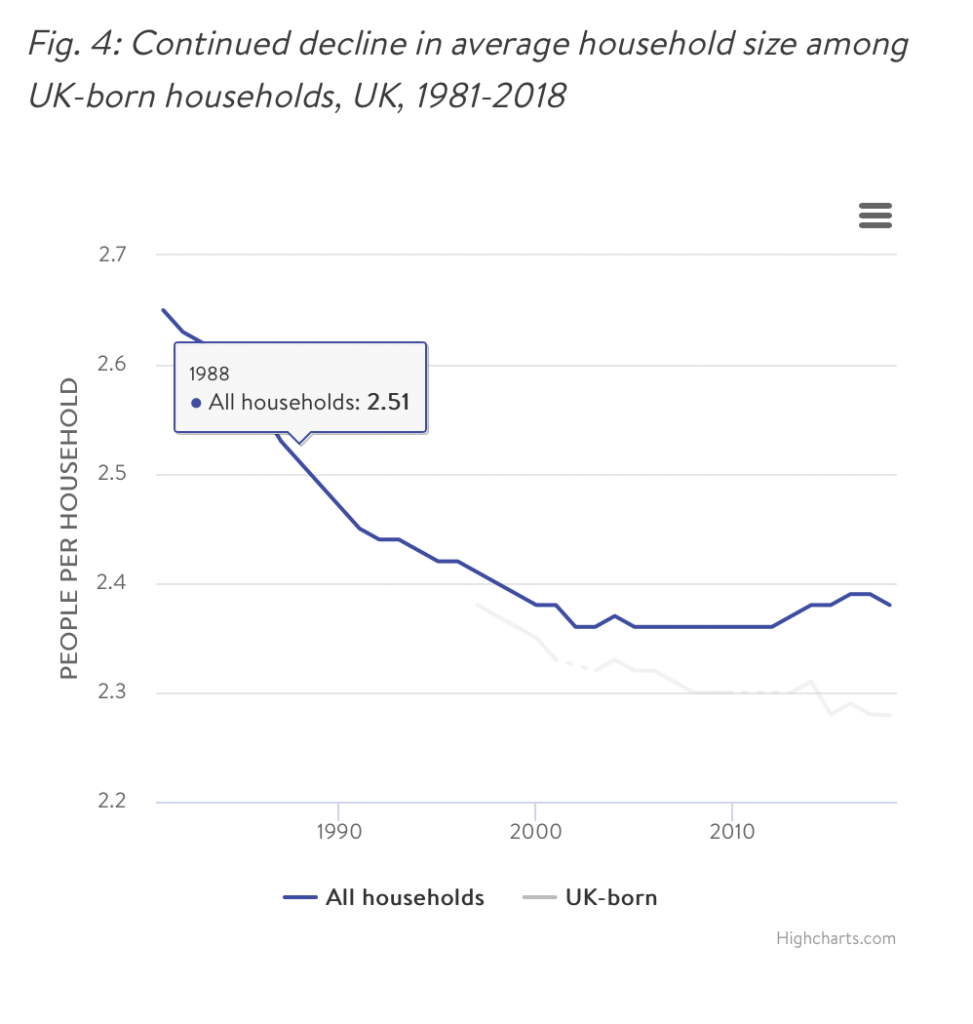
Despite the encouraging data on volumes and the affordability of market housing costs on average, other trends are less benign. First, the average household size across the UK has risen slightly in recent years, despite an ageing population leading us to anticipate continued decline. Second, survey data suggest that there are now 400,000 more families or individuals sharing a house with other families or individuals – so-called ‘hidden households’ – than there would have been had the proportions stayed constant since the late 1990s. These developments are sometimes thought of as evidence of constrained household formation. However, both trends appear to be explained by the higher rate of migration to the UK over recent years: among UK-born households, average household size has continued to fall, and there has been no rise in the proportion of UK-born hidden households (see Fig. 4). The uptick in both trends nationally therefore appears to be driven by a bigger proportion of young, often single, migrants who survey data suggest have always had a greater tendency to share housing.
An accompanying development is that there are almost one million more 20-to-34-year olds now living with their parents than there were in 2002. This stark change seems likely to be the result of reduced affordability of housing for young people – but for reasons unrelated to general housing supply. Weak wage growth, particularly since the financial crisis, and housing benefit cuts have disproportionately affected young people, reducing rent affordability for many of them even as it improves on average. A further factor is the erosion of social housing as an option for young people, with almost 700,000 more of them now having to choose between paying market rents or living with their parents, compared to 1996. Tackling these distributional problems directly is likely to be a far more effective strategy to help young people than additional market supply.
The collapse of home ownership
High house prices are often seen as the cause of the collapse in home ownership across the UK. However a closer look at the data suggests that the mortgage market is a more important factor.
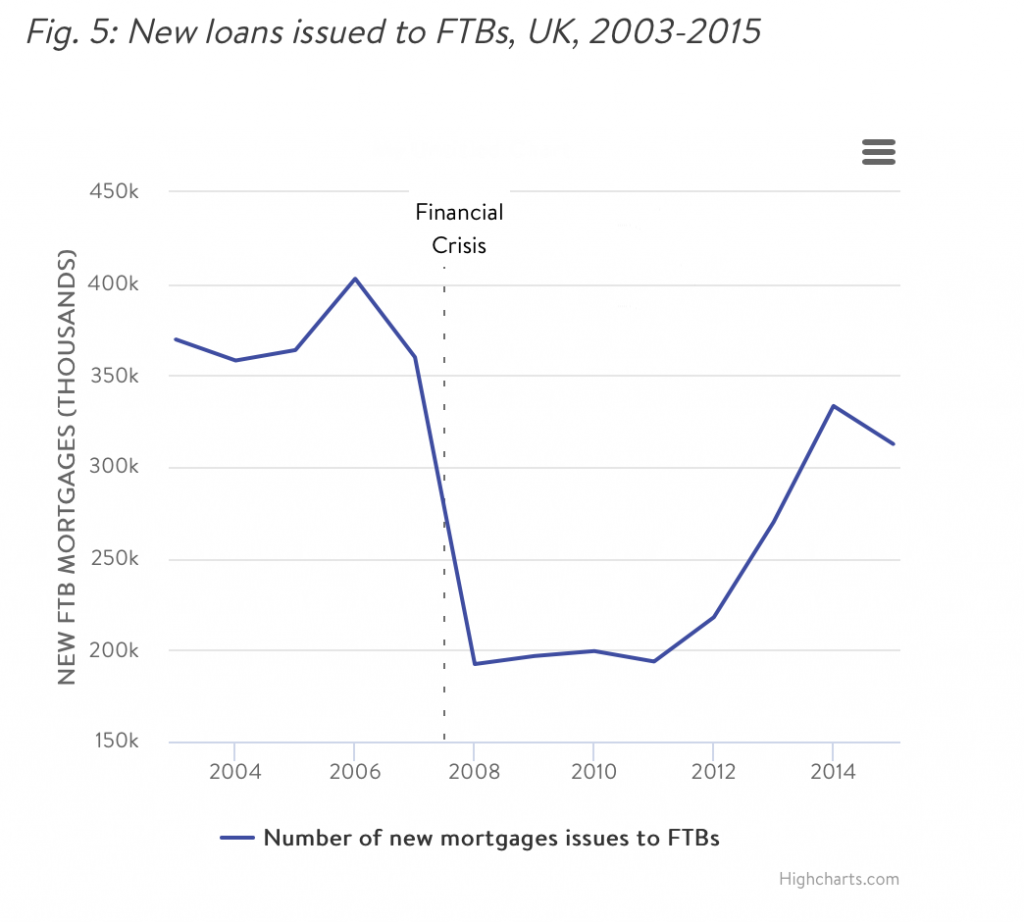
In England, home ownership peaked at 70.5% in 2003 but collapsed quickly from 69.1% in 2007 to 63.1% by 2016 – a period that saw quite sharp price falls across much of the country. The dominant cause of the collapse was the abrupt slowdown in mortgage lending to FTBs, which almost halved between 2007 and 2008, and did not recover until around 2014 (see Fig. 5). This was reflected in a sudden drop in the median LTV for new FTB loans, from 90% in 2007 to 75% in 2009. Had new FTB mortgage issuance persisted at its pre-crisis rate, home ownership would not have fallen in the subsequent years.
Consequently, there is little reason to believe that supplying an additional 300,000 houses per year would raise home ownership. This is both because its impact on prices would be limited, and because ownership rates are much less sensitive to prices than they are to mortgage availability.
Policy implications
This analysis carries several important implications for the direction of housing policy in the 2020s.
- Plans to boost housing supply above their current rates will not solve problems of high house prices or low home ownership. Instead, greater supply is likely to result in further growth in the number of unoccupied houses, which may not be an efficient use of scarce investment capital.
- Growing housing affordability problems in the rented sector appears to be due to a combination of slow wage growth for young people, erosion of the social housing stock, and housing benefit cuts. Tackling these problems directly would be a far more potent (and less economically costly) way to improve affordability than boosting market supply.
- House prices are vulnerable to an end to the era of low interest rates and a reversal of overseas investment flows, with potentially serious political consequences. This should raise questions for policymakers about whether and how to insulate households from asset price volatility in future.
- If financial stability in the mortgage market is to remain a policy priority, a return to higher rates of home ownership will require more fiscal intervention either to subsidise FTBs or to reduce financial incentives for landlords. Either way, recent rapid growth in the number of families in the private rented sector suggests that policy should urgently address the security it offers, and the quality of the service renters receive.
FULL PAPER
You can download Ian’s full paper for the UK Collaborative Centre for Housing Evidence from their website.
Originally published by The Tony Blair Institute for Global Change https://institute.global/insight/renewing-centre/tackling-uk-housing-crisis


