


New warehouse supply has reacted robustly to the current strength of demand in Europe. As a result, completions have recently reached nearly double the levels at the height of the last cycle. We address here whether there is a risk that future supply could produce a surplus, or whether take-up will continue to be sufficient to absorb the space delivered, especially as the vast majority is built to suit, not speculative.
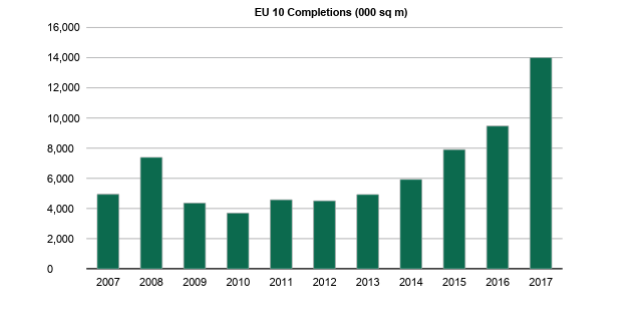
Completions are at record levels
Completions have been steadily recovering since 2011, exceeding the previous cyclical peak in 2015. In 2017 delivery of new space outstripped the record level of 2016 in the first nine months alone. In the ten core markets (UK, France, Germany, Netherlands, Spain, Italy, Poland, Hungary, Belgium, Czech Republic) there was c.14m sqm of new space delivered last year, nearly double the annual total in 2008.
Source: CBRE Research
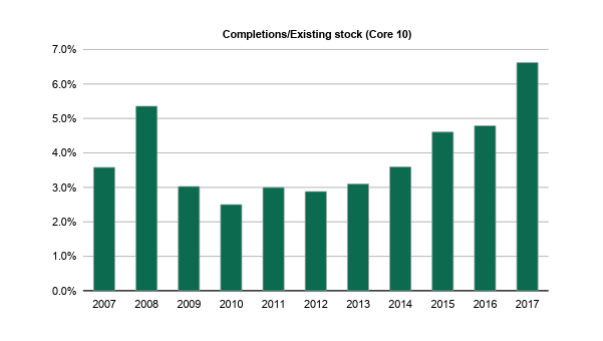
To put this in context, completions as a percentage of existing stock have also surpassed the previous peak of 5.4% in 2008. They exceeded 5% in the first nine months of 2017 alone, continuing the upward trajectory since 2012, to reach 6.5% for last year. It seems likely the previous peak will be exceeded again in 2018, given the current pipeline.
Source: CBRE Research
Demand still exceeds supply, even where deliveries are highest
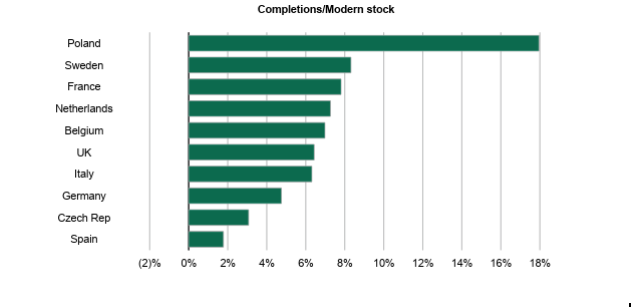
However, the situation varies hugely depending on the country. As the chart below shows, completions in Poland reached 18% of existing stock in 2017. This is well ahead of the trend in the past two years, which has averaged c.10.5%. Nevertheless, in 2017 take-up in Poland increased 32% YoY. Even after a 138% surge in deliveries, take-up exceeded completions by 38% in 2017, such that vacancy fell further to 4.7%. Other than Belgium the same was true of all markets in 2017. In aggregate take-up exceeded completions by 64%. Only in the Netherlands did the vacancy rate increase slightly in 2017.
Source: CBRE Research
What is the wider market vacancy backdrop?
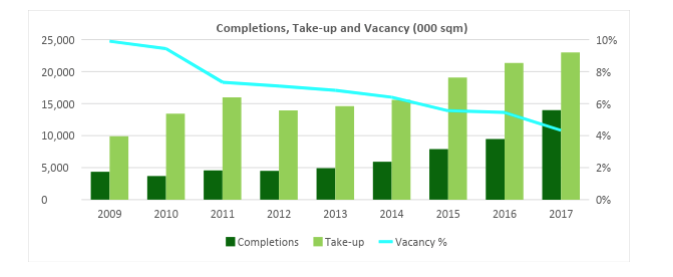
Average vacancy for the ten core countries fell below 4.5% at the end of 2017, from 5.5% in 4Q16, with take-up running well ahead of new supply during the year. This is in line with the normal trend as the chart below shows. Although this does show that completions have been rising steadily for the past few years, it also highlights there has been sufficient growth in take-up to significantly exceed completions. This suggests that the supply side has been responding to the recent strength of demand, rather than in isolation. With vacancy across the region below 5% there is clearly still a need for additional market supply.
Source: CBRE Research
What is the future outlook for supply?
The core European markets generally have low vacancy rates and a limited pipeline. The exceptions are Poland, which is reacting to particularly strong demand, and other markets in CEE, where take-up is also running well ahead of supply. The chart below shows the total pipeline under construction in each country, which is due for completion in the next year, as a proportion of existing modern stock. This is generally clustered in a range of 4-8% for the core markets. Similarly, vacancy rates are largely between 3% and 6%, so should be readily able to sustain this level of new development, even in the markets with larger pipelines.
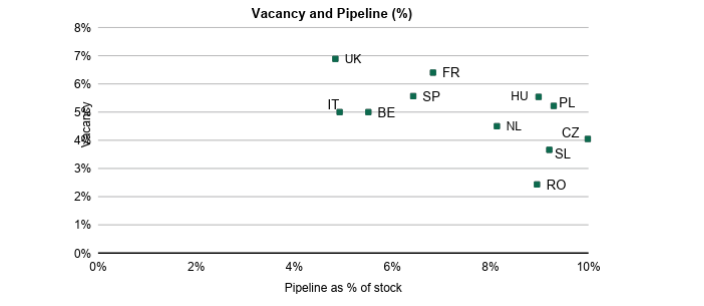
Source: CBRE Research, (For comparative purposes the UK vacancy includes all old stock, even if not suitable for current occupiers)
The vast majority of the pipeline is built to suit
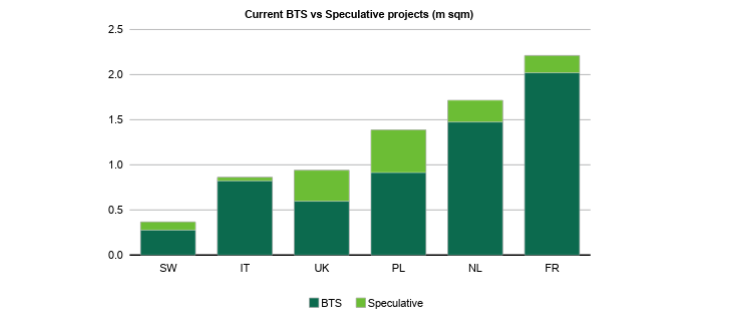
Analysing these figures more deeply for six of the markets below, shows that the vast majority of the current development pipeline is built to suit. Indeed, the speculative element in the six markets below is only 18%, or 1.4m sqm of the total of 7.5m sqm. In France and Italy speculative projects are less than 10% of the total. In the UK, which has the largest proportion, the speculative component currently accounts for 36% of the total, as the ecommerce BTS developments are significantly lower this year.
This analysis also gives further context to the previous chart. Not only do Poland and the Netherlands have low vacancy rates to help them absorb the level of development, they also have a high proportion of built to suit within the total (66% and 86% respectively), further reducing the risk of that development pipeline.
Source: CBRE Research
Per capita rates remain low in Europe
Another potential area of support for the European logistics market is the disparity between the amount of existing modern warehouse space in Europe and the US. The comparison between per capita levels of space in the two regions suggests Europe should be able to sustain years of further supply growth without too much risk of oversupply. The EU currently has less than 60% of the US level, with just 0.7 sqm per capita, compared with 1.2 sqm in the US, although there are geographic reasons for the higher levels in the US.
The US supply example is also instructive for completions and rents. Although completions have run at c.90% of net absorption during 2017, industrial rental growth was still running at c.6%.
What does this mean for the 2018 outlook?
The average level of total pipeline relative to existing stock across the region is currently below 7%. This is only marginally higher than the average rate of completions in 2017, when vacancy continued to fall. With vacancy below 4.5% and take-up continuing to increase, there is clearly a need for additional supply. Therefore, at this level of vacancy, increased completions should not prevent rental rates increasing in many markets in 2018, as we currently forecast.
Also, as the vast majority of this new development is built to suit, it will not hit the market, so should have a limited impact on the outlook for rental rates. Finally, with construction costs rising and land becoming more scarce, development seems unlikely to remain at current levels, or may shift further to brownfield sites, suggesting higher levels of redevelopment.


