


The Physical Market Cycle Analysis of 5 Property Types in 54 Metropolitan Statistical Areas (MSAs).
The economic expansion has been solid with 1Q GDP growth at 3.1%, which also drove continued job and wage growth so far in 2019. Trade uncertainty moved investors toward safety and drove the 10-year treasury down to a 2.16% yield in May, which should help to keep mortgage interest rates low and real estate’s positive financial leverage position very favorable. Demand and supply growth are in equilibrium balance in more markets and property types than ever before. We expect the moderate economic expansion to continue for a few years.
Office occupancy decreased 0.1% in 1Q19, rents grew 0.5% for the quarter and 2.1% annually.
Industrial occupancy decreased 0.1% in 1Q19, rents grew 1.1% for the quarter and 5.6% annually.
Apartment occupancy increased 0.1% in 1Q19, rents grew 1.3% for the quarter, but grew 3.2% annually.
Retail occupancy was flat in 1Q19, rents grew 0.1% for the quarter and 1.4% annually.
Hotel occupancy increased 0.3% in 1Q19, room rates grew 2.5% for the quarter but grew 3.6% annually.
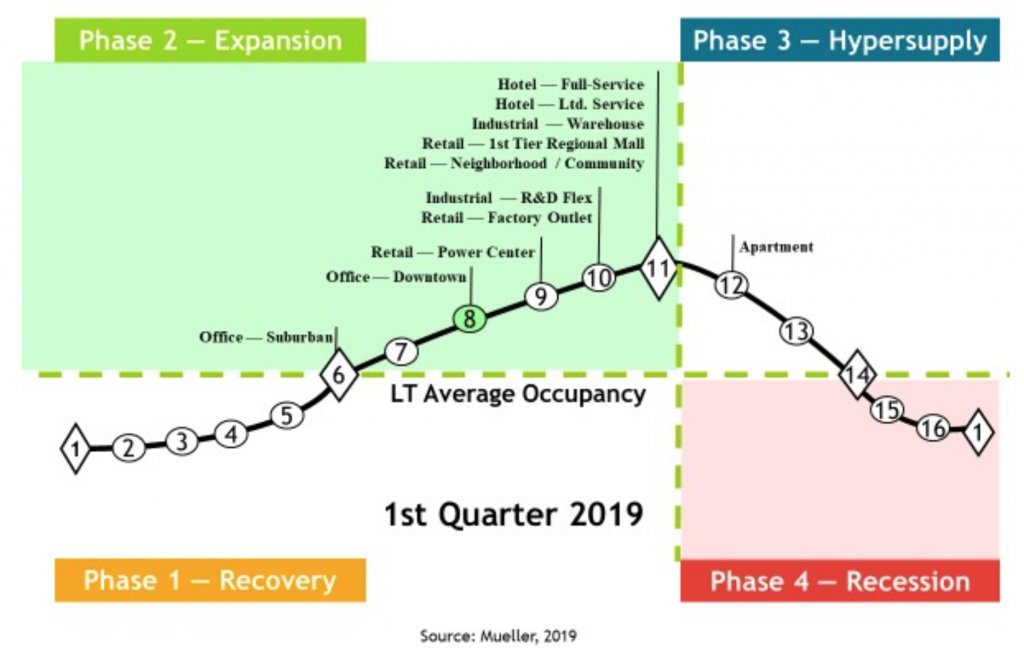
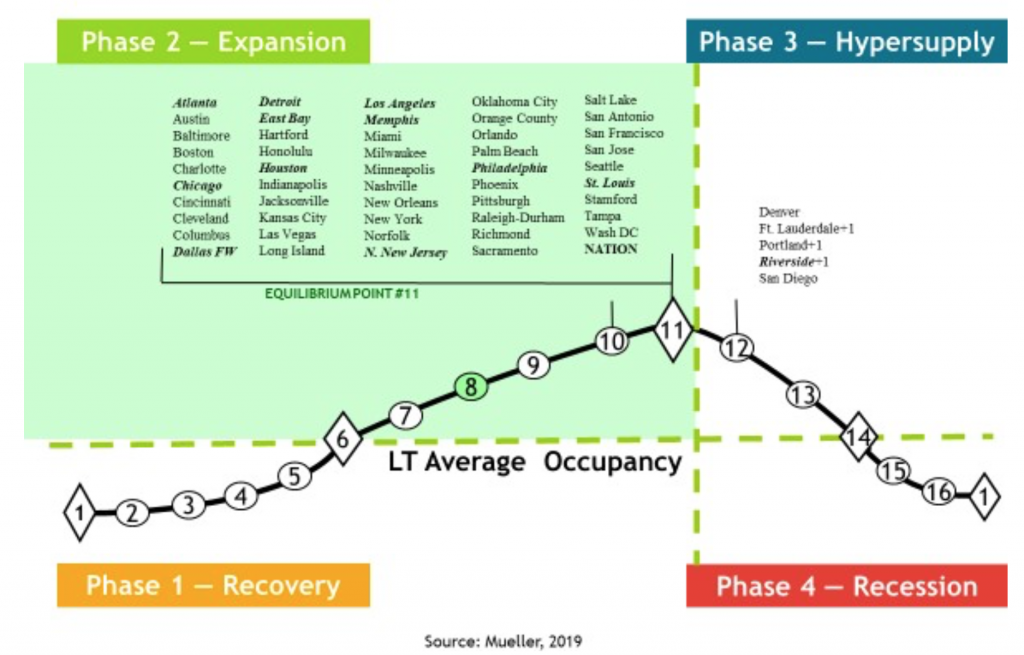
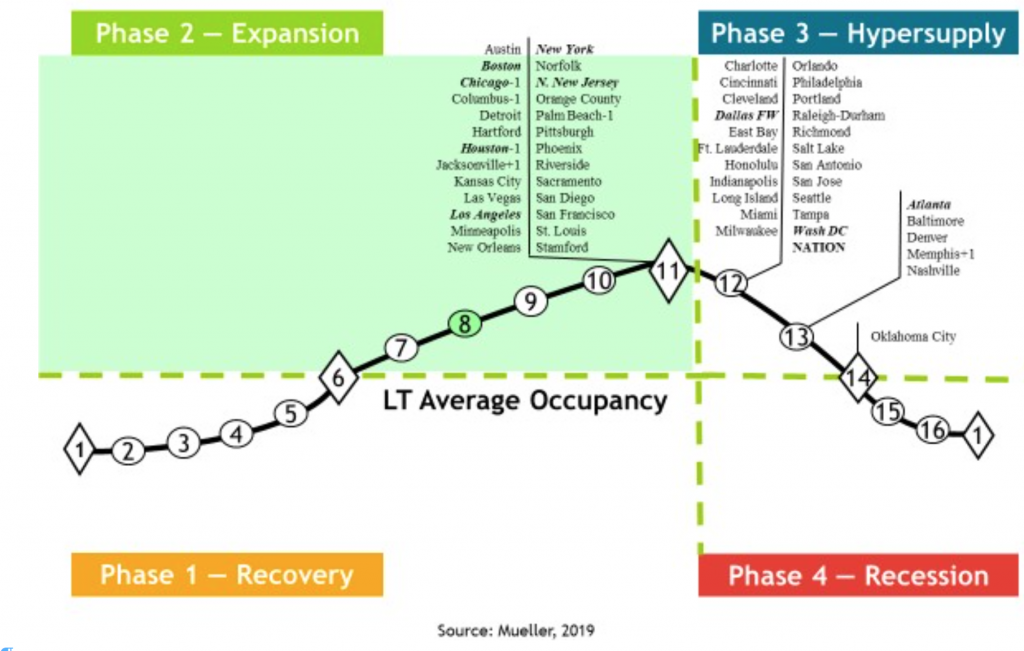
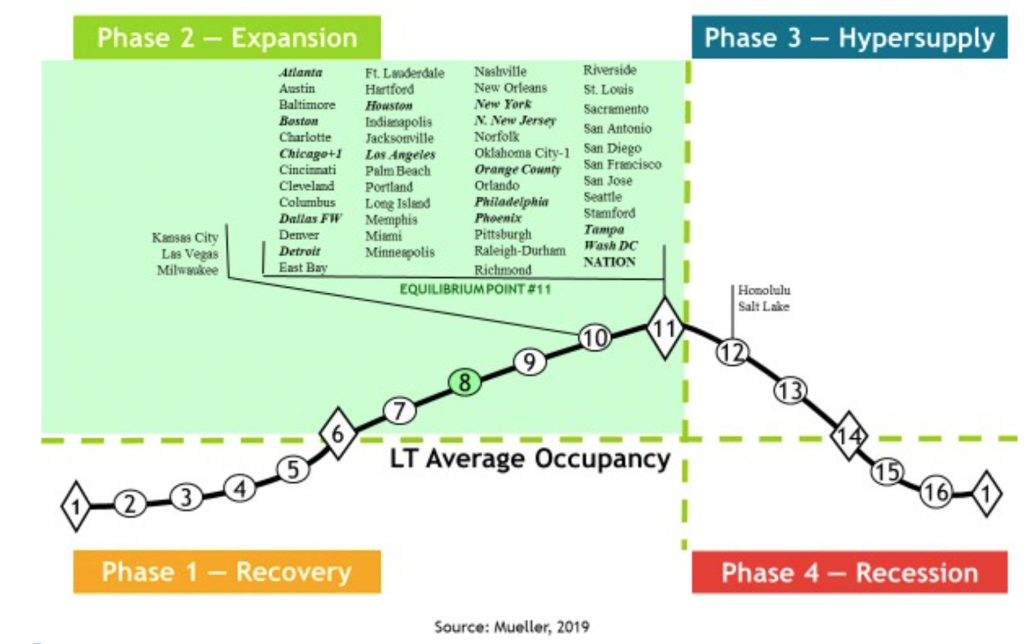
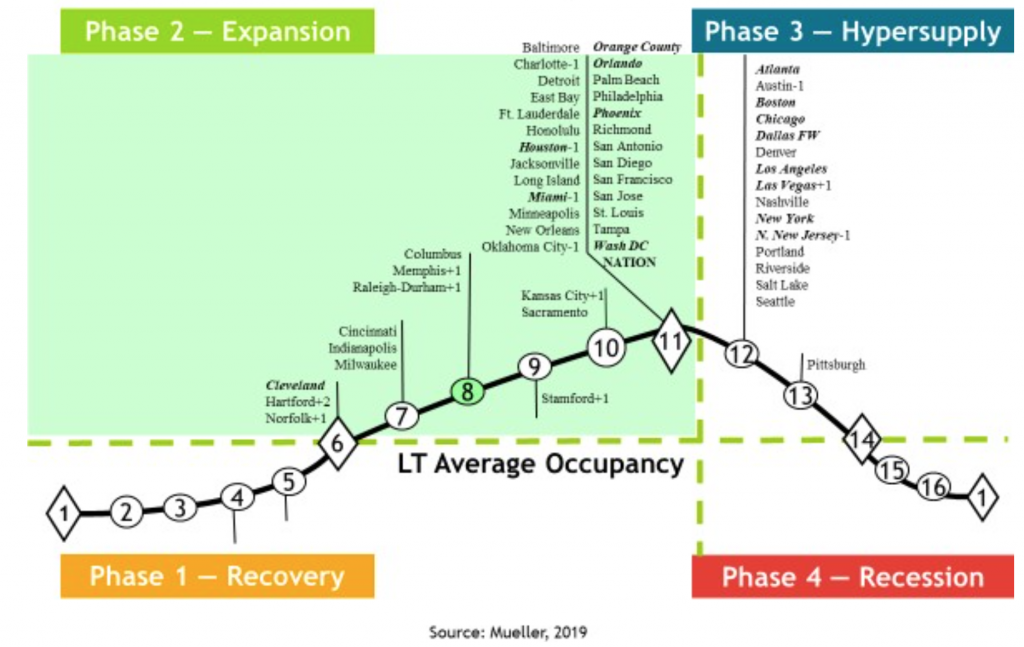
The National Property Type Cycle Locations graph shows relative positions of the sub-property types.
The cycle monitor analyses occupancy movements in five property types in 54 MSAs. Market cycle analysis should enhance investment-decision capabilities for investors and operators. The five property type cycle charts summarise almost 300 individual models that analyse occupancy levels and rental growth rates to provide the foundation for long-term investment success. Commercial real estate markets are cyclical due to the lagged relationship between demand and supply for physical space. The long-term occupancy average is different for each market and each property type. Long-term occupancy average is a key factor in determining rental growth rates — a key factor that affects commercial real estate income and thus returns.
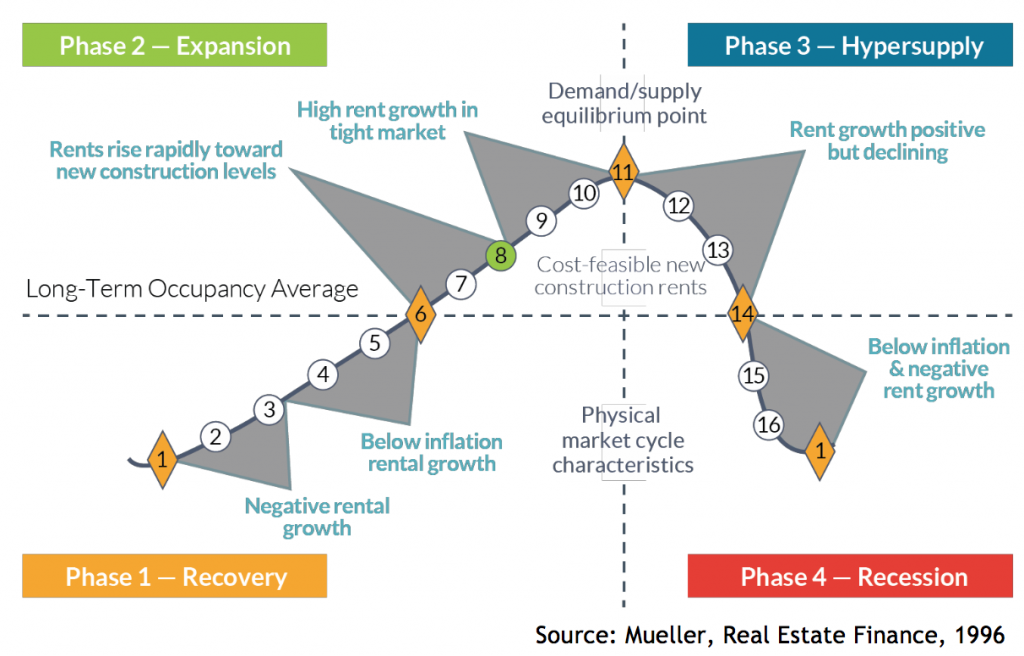
Market Cycle Quadrants
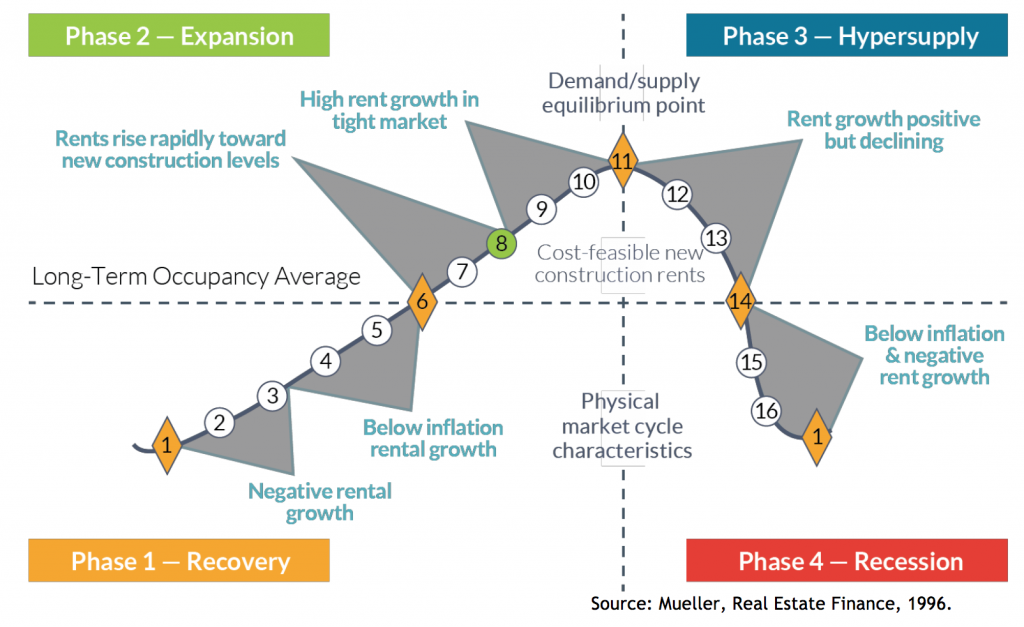
Rental growth rates can be characterized in different parts of the market cycle, as shown below.
Office
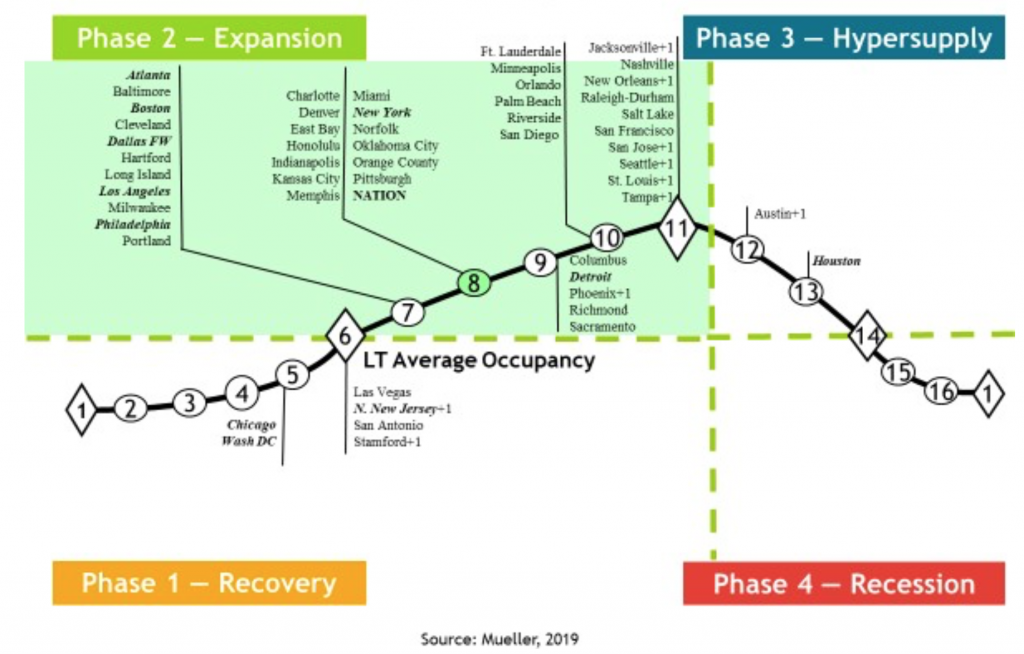
The national office market occupancy level decreased 0.1% in 1Q19, but was up 0.3% year-over-year. Continued GDP and employment growth are driving moderate office demand growth. More landlords are adopting short term rental programs to compete with WeWorks and other flex rental companies.
Daily rental rates cost as much as four times long term lease rates, but include furniture and support equipment. They are offering additional services as well to increase profitability. It has become the favoured option for start-up companies and large firm expansions. New York has the highest amount of short term office lease space in the United States. New office supply continued at reasonable rates and six markets moved to peak/equilibrium occupancy levels. Only one market, Austin, had too much supply growth that pushed it into the hyper-supply phase of the cycle. Average national rents increased 0.5% in 1Q19 and produced a 2.1% increase year-over-year.
Office Market Cycle Analysis 1Q19
Note: The 11-largest office markets make up 50% of the total square footage of office space we monitor. Thus, the 11-largest office markets are in bold italic type to help distinguish how the weighted national average is affected.
(Markets that have moved since the previous quarter are now shown with a + or – symbol next to the market name and the number of positions the market has moved is also shown, i.e., +1, +2 or -1, -2. Markets do not always go through smooth forward-cycle movements and can regress or move backward in their cycle position when occupancy levels reverse their usual direction. This can happen when the marginal rate of change in demand increases (or declines) faster than originally estimated or if supply growth is stronger (or weaker) than originally estimated.)
Industrial
Industrial occupancies declined 0.1% in 1Q19 and were flat year-over-year, as equilibrium occupancy levels continued in almost all markets. Only three markets experienced too much supply, moving them into the hyper-supply phase of the cycle. Expansion for internet fulfillment delivery by many retailers continues to be the top driving force in demand. We also see more demand in secondary markets for internet fulfillment and last mile delivery strategies. Building layout and location for last mile delivery has not yet become standardised, so many options are being tried. Industrial national average rents increased 1.1% in 1Q19 and increased 5.6% year-over-year.
Industrial Market Cycle Analysis 1Q19
Note: The 12-largest industrial markets make up 50% of the total square footage of industrial space we monitor. Thus, the 12-largest industrial markets are in bold italic type to help distinguish how the weighted national average is affected.
Apartment
The national apartment occupancy average increased 0.1% in 1Q19 and improved 0.4% year-over-year. Moderate and stable demand growth continued with the expanding jobs market and increased GDP growth. Assuming no major challenging events, we expect this demand to continue for at least the next four years as the demographic wave of millennials graduating and getting jobs continues. However, the recent lower interest rates in May 2019 may allow more renters to purchase homes, putting a drag on demand growth. Supply growth moderated slightly in a number of markets, allowing them to move back to peak equilibrium occupancy levels. Average national apartment rent growth increased 1.3% in 1Q19 and national average rents increased 3.2% year-over-year.
Apartment Market Cycle Analysis 1Q19
Note: The 10-largest apartment markets make up 50% of the total square footage of multifamily space we monitor. Thus, the 10-largest apartment markets are in bold italic type to help distinguish how the weighted national average is affected.
Retail
Retail occupancies were flat in 1Q19 and up 0.1% year-over-year. Net supply growth was again moderate as non-functional space was converted to other uses and new concept space construction in good locations was moderate. More internet retailers are opening bricks and mortar stores to compete and have a location for both last mile pickups and returns to reduce their shipping costs. Downtown retail is doing well as millennials have chosen to live downtown. Amazon continues to try new store concepts and refine existing ideas. Trying to standardise offerings in Whole Foods grocery stores was a failure and Amazon quickly learned that local tastes are important in the grocery business. National average retail rents increased 0.1% in 1Q19 and increased 1.4% year-over-year.
Retail Market Cycle Analysis 1Q19
Note: The 14-largest retail markets make up 50% of the total square footage of retail space we monitor. Thus, the 14-largest retail markets are in bold italic type to help distinguish how the weighted national average is affected.
Hotel
Hotel occupancies increased 0.3% in 1Q19 and were up 0.4% year-over-year. Continued average occupancy levels above 70% in many markets creates great profitability and the push to produce more supply to capture that demand and create more profits. More unique concepts are surfacing and broader offerings from major brands are being developed, many are embraced by both leisure and business travelers. Many chains are also offering management for home rental (Airbnb) participants. The hassle of collecting and paying room taxes, as well as monitoring and controlling tenant activity to avoid local fines has turned off some home owner/rental participants. On the other hand, some apartment purchasers are doing nightly rentals to fill vacant apartment units. The national average hotel room rate increased 2.5% in 1Q19 and increased 3.6% year-over-year.
Hotel Market Cycle Analysis 1Q19
Note: The 14-largest hotel markets make up 50% of the total square footage of hotel space that we monitor. Thus, the 14- largest hotel markets are in bold italic type to help distinguish how the weighted national average is affected.
Market Cycle Analysis — Explanation
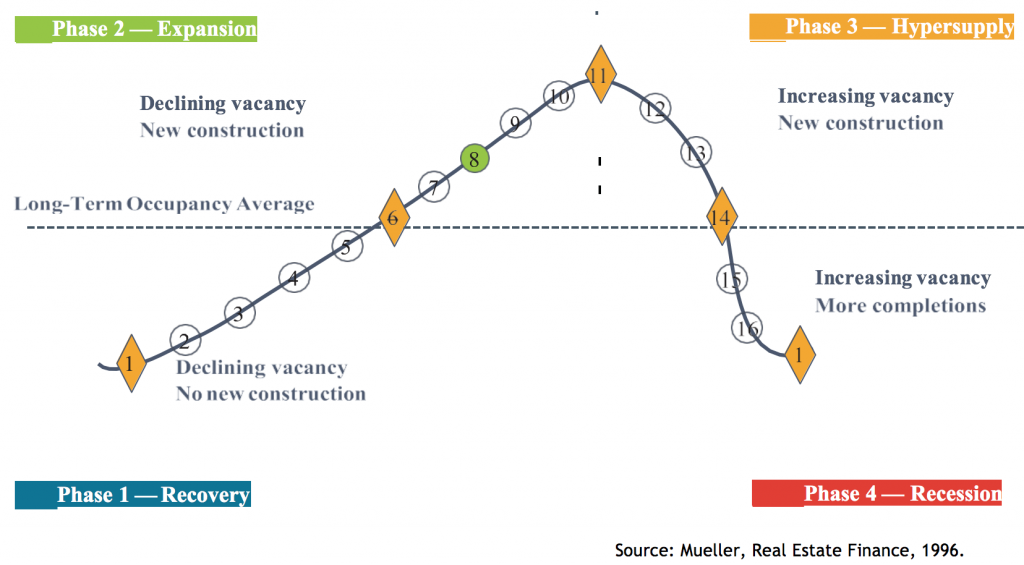
Supply and demand interaction is important to understand. Starting in Recovery Phase I at the bottom of a cycle (see chart below), the market place is in a state of oversupply from either previous new construction or negative demand growth. At this bottom point, occupancy is at its trough. Typically, the market bottom occurs when the excess construction from the previous cycle stops. As the cycle bottom is passed, demand growth begins to slowly absorb the existing oversupply and supply growth is nonexistent or very low. As excess space is absorbed, vacancy rates fall, allowing rental rates in the market to stabilize and even begin to increase. As this recovery phase continues, positive expectations about the market allow landlords to increase rents at a slow pace (typically at or below inflation). Eventually, each local market reaches its long-term occupancy average, whereby rental growth is equal to inflation.
In Expansion Phase II, demand growth continues at increasing levels, creating a need for additional space. As vacancy rates fall below the long-term occupancy average, signaling that supply is tightening in the marketplace, rents begin to rise rapidly until they reach a cost-feasible level that allows new construction to commence. In this period of tight supply, rapid rental growth can be experienced, which some observers call ‘rent spikes’. (Some developers may also begin speculative construction in anticipation of cost-feasible rents if they are able to obtain financing). Once cost-feasible rents are achieved in the marketplace, demand growth is still ahead of supply growth – a lag in providing new space due to the time to construct. Long expansionary periods are possible and many historical real estate cycles show that the overall up-cycle is a slow, long-term uphill climb. As long as demand growth rates are higher than supply growth rates, vacancy rates will continue to fall. The cycle peak point is where demand and supply are growing at the same rate or equilibrium. Before equilibrium, demand grows faster than supply; after equilibrium, supply grows faster thandemand.
Hypersupply Phase III of the real estate cycle commences after the peak/equilibrium point #11 — where demand growth equals supply growth. Most real estate participants do not recognize this peak/equilibrium’s passing, as occupancy rates are at their highest and well above long-term averages, a strong and tight market. During Phase III, supply growth is higher than demand growth (hypersupply), causing vacancy rates to rise back toward the long-term occupancy average. While there is no painful oversupply during this period, new supply completions compete for tenants in the market place. As more space is delivered to the market, rental growth slows. Eventually, market participants realise that the market has turned down and commitments to new construction should slow or stop. If new supply grows faster than demand once the long-term occupancy average is passed, the market falls into Phase IV.
Recession Phase IV begins as the market moves past the long-term occupancy average with high supply growth and low or negative demand growth. The extent of the market down-cycle will be determined by the difference (excess) between the market supply growth and demand growth. Massive oversupply, coupled with negative demand growth (that started when the market passed through long-term occupancy average in 1984), sent most U.S. office markets into the largest down-cycle ever experienced. During Phase IV, landlords realise that they will quickly lose market share if their rental rates are not competitive. As a result, they then lower rents to capture tenants, even if only to cover their buildings’ fixed expenses. Market liquidity is also low or nonexistent in this phase, as the bid–ask spread in property prices is too wide. The cycle eventually reaches bottom as new construction and completions cease, or as demand growth turns up and begins to grow at rates higher than that of new supply added to the market place.
This research currently monitors five property types in 54 major markets. We gather data from numerous sources to evaluate and forecast market movements. The market cycle model we developed looks at the interaction of supply and demand to estimate future vacancy and rental rates. Our individual market models are combined to create a national average model for all U.S. markets. This model examines the current cycle locations for each property type and can be used for asset allocation and acquisition decisions.


