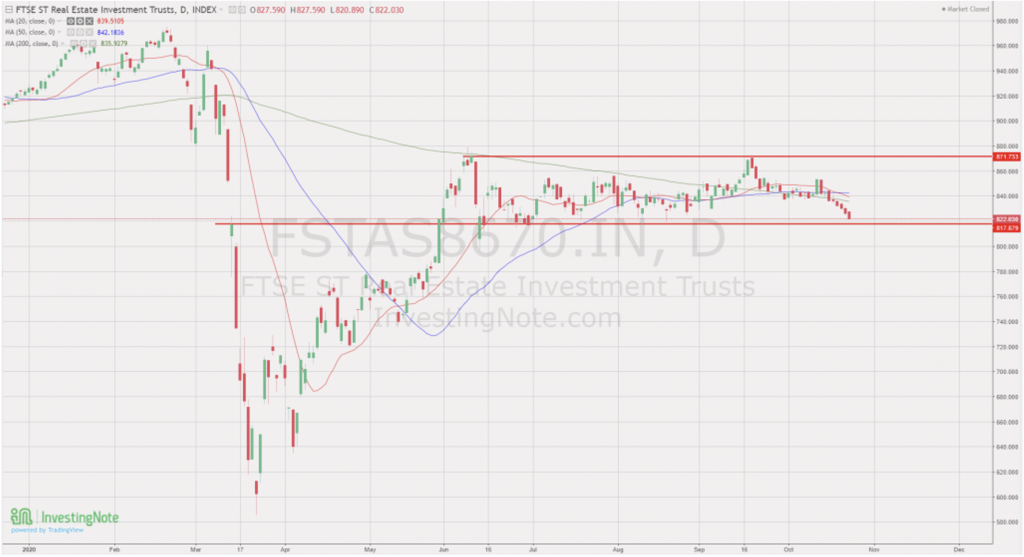
- FTSE ST REIT Index decreased slightly from 854.51 to 822.03 (-3.80%) on the month update.
- REIT Index has rebounded by about 45% as of 21 September from the bottom on 23 March 2020.
- Yield spread (reference to 10-year Singapore government bond of 1.0%) has widen slightly from 5.608% to 5.82%.
- The risk premium is still attractive to accumulate Singapore REITs in stages to lock in the current price and long-term yield after the recovery.
- Technically the REIT Index is currently trading on sideways consolidation with low volatility until the breakout. The breakout may happen in the current earning season in October. Current macro factors such as low interest rate environment and recovery of global economic support the bullish breakout.
Technical analysis
The FTSE ST REIT Index decreased slightly from 854.51 to 822.03 (-3.80%) compared with last month’s update. The REIT Index has rebounded by about 45% as of 21 September from the bottom on 23 March 2020.
Currently the REIT Index is trading on sideway consolidation, sandwiched between a very tight range between 817 support and 871 resistance. There is a Bollinger Band Squeeze with very tight range and low volatility on the FTSE ST REIT Index. The index could start a big move in either direction.
There was a false Golden Cross 20D/50D/200D SMA breakout and an inability to kick-start the uptrend of the REIT Index. Currently the REIT index is trading near to the critical support level at about 817.
As for now, the short-term direction is sideways, until breakout of the resistance (starts an up-trend) or breakdown of the support (starts a down-trend).
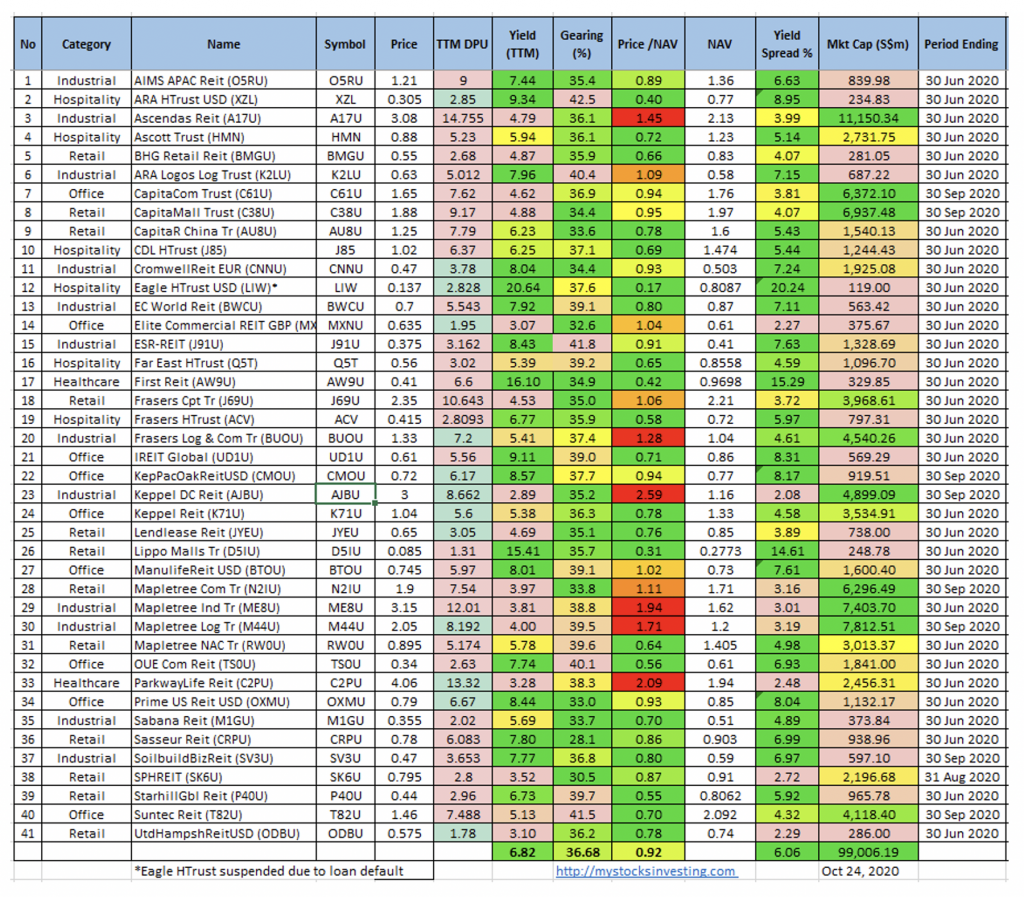
Most overvalued REITs
- Keppel DC REIT (price/NAV = 2.59)
- Parkway Life REIT (price/NAV = 2.09)
- Mapletree Industrial Trust (price/NAV = 1.94)
- Mapletree Logistic Trust (price/NAV = 1.71)
- Ascendas REIT (price/NAV = 1.45).
Most undervalued REITs
- Eagle Hospitality Trust* (price/NAV =0.17)
- ARA Hospitality Trust (price/NAV = 0.40)
- First REIT (price/NAV = 0.42)
- Lippo Malls Indonesia Retail Trust (price/NAV = 0.31)
- Starhill Global REIT (price/NAV = 0.55)
(*Eagle Hospitality Trust is currently suspended)
Highest distribution yield (TTM)
- First REIT (16.10%)
- Lippo Malls Indonesia Retail Trust (15.41%)
- ARA Hospitality Trust (9.34%)
- Keppel Pacific Oak US REIT (8.57%)
- Prime US REIT (8.44%)
(Reminder: these yield numbers are based on current prices taking into account delayed distribution/dividend cuts due to covid-19. Some REITs opted for semi-annual reporting and thus no quarterly DPU was announced.)
Highest gearing ratio REITs
- ARA Hospitality Trust (42.5%)
- ESR REIT (41.8%)
- Suntec REIT (41.3%)
- ARA Logos Log Trust (40.4%)
- OUE Commercial REIT (40.1%)
(Singapore REIT has a gearing limit of 50%.)
Top five REITs with biggest market capitalisation
- Ascendas REIT (S$11.15B)
- Mapletree Logistics Trust (S$7.81B)
- Mapletree Industrial Trust ($7.40B)
- CapitaMall Trust (S$6.94B)
- Mapletree Commercial Trust ($6.30B)
Bottom five REITs with smallest market capitalisation
- Eagle Hospitality Trust (S$119M)
- BHG REIT (S$281M)
- ARA Hospitality Trust ($235M)
- United Hamsphire REIT ($286M)
- Elite Commercial REIT ($376M)
(*Eagle Hospitality Trust is currently suspended)
Fundamental analysis of 41 Singapore REITs
The chart below is the compilation of 41 REITs in Singapore with colour coding for the distribution yield, gearing ratio and price to NAV ratio. This gives investors a quick glance of which REITs are attractive enough to have an in-depth analysis. (Source is here.)
Note 1: The financial ratios are based on past data and there are lagging indicators.
Note 2: This REIT table takes into account the dividend cuts due to the covid-19 outbreak. Yield is calculated trailing 12 months (TTM), therefore REITs with delayed payouts might have lower displayed yields, thus yield displayed might be lower.
Note 3: Currently we are entering into Singapore REITs quarterly earnings season, REITs data such as CCT, CMT, MCT, MLT, KDC, SPHREIT, KepPacOak US REIT, SuntecREIT have been updated.
• Price/NAV decreased from 0.96 to 0.92 (the Singapore overall REIT sector is very undervalued now).
• Distribution yield increased from 6.49% to 6.82% (take note that this is lagging number). About 36.61%% of Singapore REITs (16 out of 41) have distribution yield > 7%. Do note that these yield numbers are based on current prices taking into account delayed distribution/dividend cuts due to covid-19.
• Gearing ratio increases from 36.61% to 36.68%. In general, the Singapore REITs sector gearing ratio is healthy. Note: Gearing may be affected (i.e. potential increase) as the valuation of the portfolio would be reduced.