


US Companies are paying shareholders more than they can afford
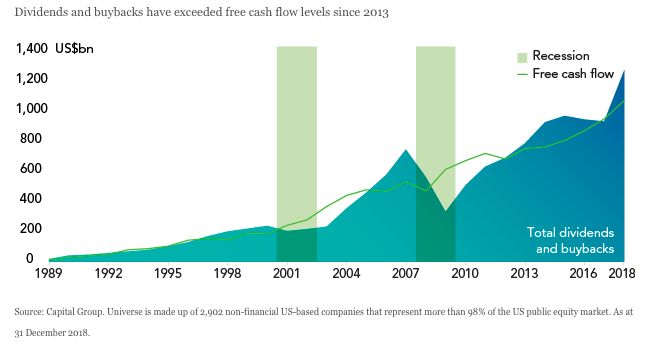
Dividends and buybacks have exceeded free cash flow levels since 2013
Source: Capital Group. Universe is made up of 2,902 non-financial US-based companies that represent more than 98% of the US public equity market. As at 31 December 2018.
Imagine a household budget where the money flowing out exceeds the money coming in by 10-15% each year. Just like drinking too much, this might be fun in the short term, but it usually leads to a hangover.
This is a good analogy for Corporate America. This month’s chart considers nearly 3,000 of the largest listed non-financial companies in the US. The data shows these companies have been paying out more than their free cash flow since 2013, almost seven years!
Without getting bogged down in the accounting complexities, the chart shows free cash flow (think cash profits after maintenance spending) compared to cash returns to shareholders (buybacks plus dividends). Over time, we would expect one of these lines to cap the other: companies can only sustainably pay out to shareholders cash not required to operate their business.
This splurge has been encouraged under a variety of banners: financial engineering, shareholder value, activism, balance sheet optimisation and capital structure arbitrage. It all sounds clever and it has been rocket fuel for share prices, but the consequence has been the weakening of US balance sheets (corporate debt to GDP is at all-time highs) and the normalisation of unsustainable shareholder returns. Companies are partying like it’s 1999 whilst mortgaging their future.
Previous episodes of such excess, in the late 1990s, and in 2006-2007, both ended badly. The prosperity hinted at by these cash returns turned out to be illusory. Paying out more than you earn increases financial fragility.
The real question is if companies are paying dividends and buying back stock, what are they NOT doing? The answer is investing for the future.
Capital expenditure is moribund, business investment for organic growth remains in a forty year downtrend. This is why we have had the slowest decade of GDP growth on record whilst stock markets boom. Of course, no capital expenditure today means future growth will be lower. Shareholders are exhibiting a strong time preference for rewards today and companies are responding by sacrificing long term growth and eating themselves via buybacks.
This is the opposite of Henry Ford’s logic, which held that companies should invest in factories and workers so each employee could afford a Ford automobile. Today, US companies don’t build the factory and don’t employ the workers, so therefore can’t sell them a new car (they couldn’t afford anyway).
But if management utilise existing profits to buyback enough stock, then earnings per share will go up. Capitalism is happening on a spreadsheet rather than the shop floor. Let’s not even mention the egregious use of buybacks to offset executive compensation paid in shares. Since 2012, US corporate profits are flat, yet earnings per share on the S&P 500 are up 54%[1] and the S&P index itself is up 134%[2].
This reckless behaviour is not universal. In Japan, the story of increased shareholder returns is only just beginning. Japanese corporates have far less debt than their US counterparts. Dividends and buybacks are growing fast from a low base. Japanese balance sheets are moving from lazy to efficient, rather than from efficient to dangerously stretched. US corporates have perhaps had too much of a good thing. Japan has hardly even started.
[1] Bloomberg
[2] Bloomberg


