


A physical market cycle analysis of four property types
across 54 metropolitan statistical areas (MSAs) for 4Q2020.
GDP ended 2020 at a negative -3.5% annual growth rate, after the largest decline (2Q20) and bounce-back (3Q20) in history. Covid revenue growth, while covid ‘have-not’ firms continued to struggle and downsize, close or go bankrupt. Government stimulus was important for company and individual family financial survival. Real estate owners negotiated rent deferrals, amendments, and modifications to assist tenants. Lenders also worked hard on mortgage modifications to help borrowers survive. Low interest rates were the largest saviour in the covid economy. The future is harder to predict than any post-recession recovery in history.
Office occupancy declined 0.5% in 4Q20, and rents declined 0.2% for the quarter and were down 1.1% annually. Industrial occupancy improved 0.1% in 4Q20, and rents grew 1.0% for the quarter and 3.6% annually. Apartment occupancy declined 0.5% in 4Q20, and rents were flat for the quarter, and down 0.1% annually. Retail occupancy declined 0.3% in 4Q20, and rents declined 0.4% for the quarter and were down 0.6% annually.
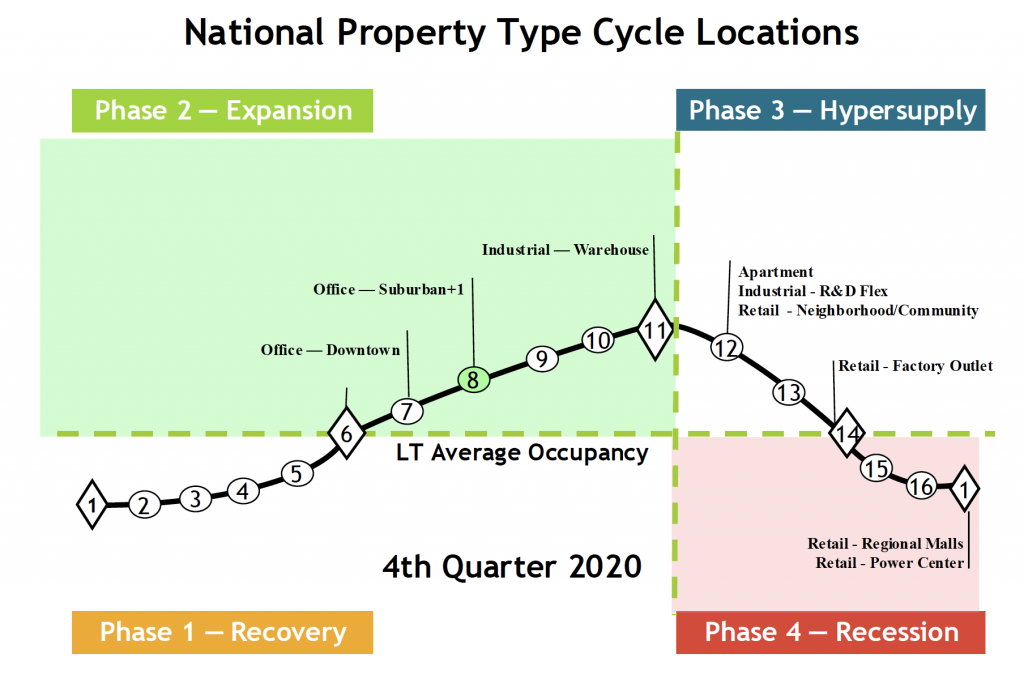
Note: Graph shows relative positions of the sub-property types.
The cycle monitor analyses occupancy movements in five property types in 54 MSAs. Market cycle analysis should enhance investment-decision capabilities for investors and operators. The five property type cycle charts summarise almost 300 individual models that analyse occupancy levels and rental growth rates to provide the foundation for long-term investment success. Commercial real estate markets are cyclical due to the lagged relationship between demand and supply for physical space. The long-term occupancy average is different for each market and each property type. Long-term occupancy average is a key factor in determining rental growth rates — a key factor that affects commercial real estate income and thus returns.
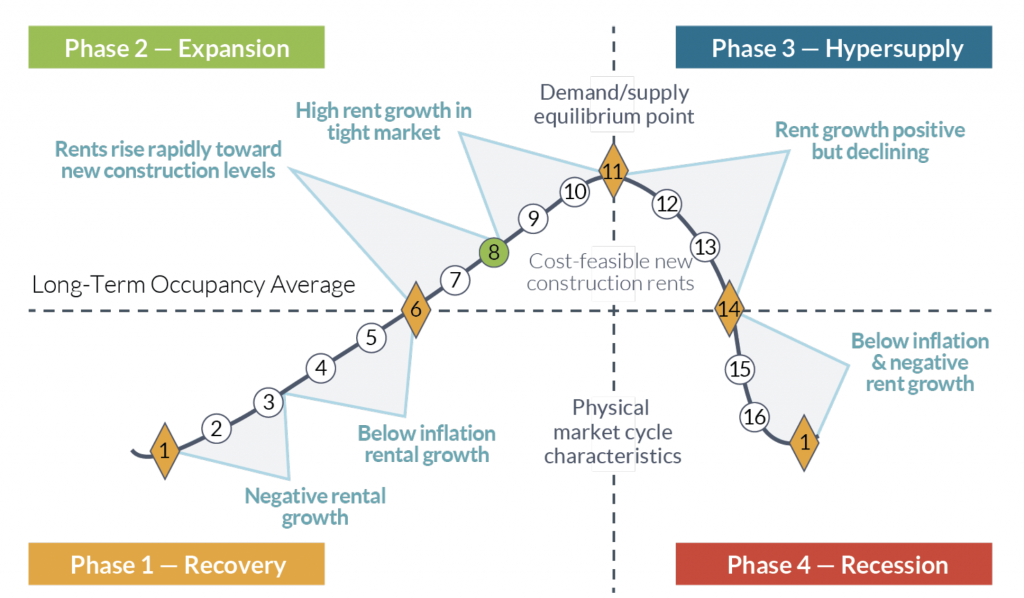
Market cycle quadrants
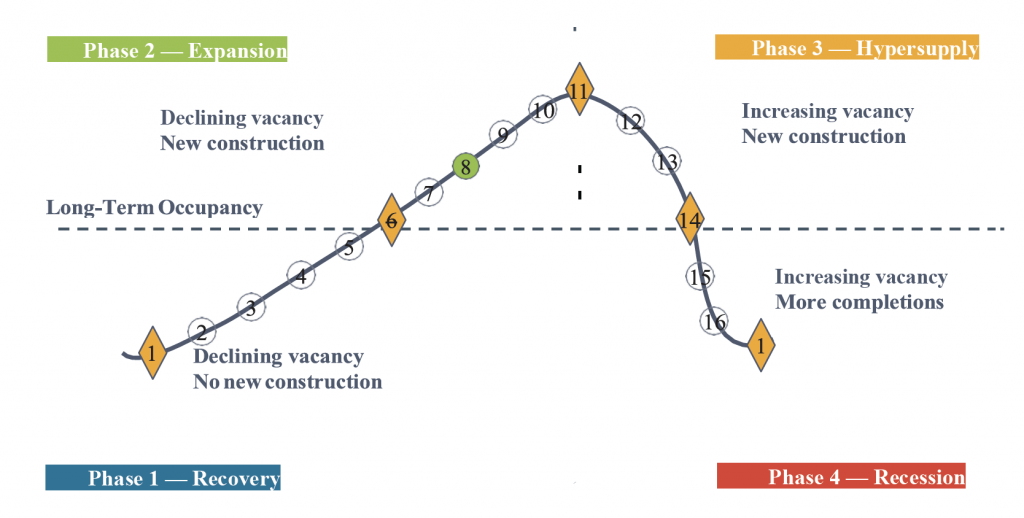
Source: Mueller, Real Estate Finance, 1996
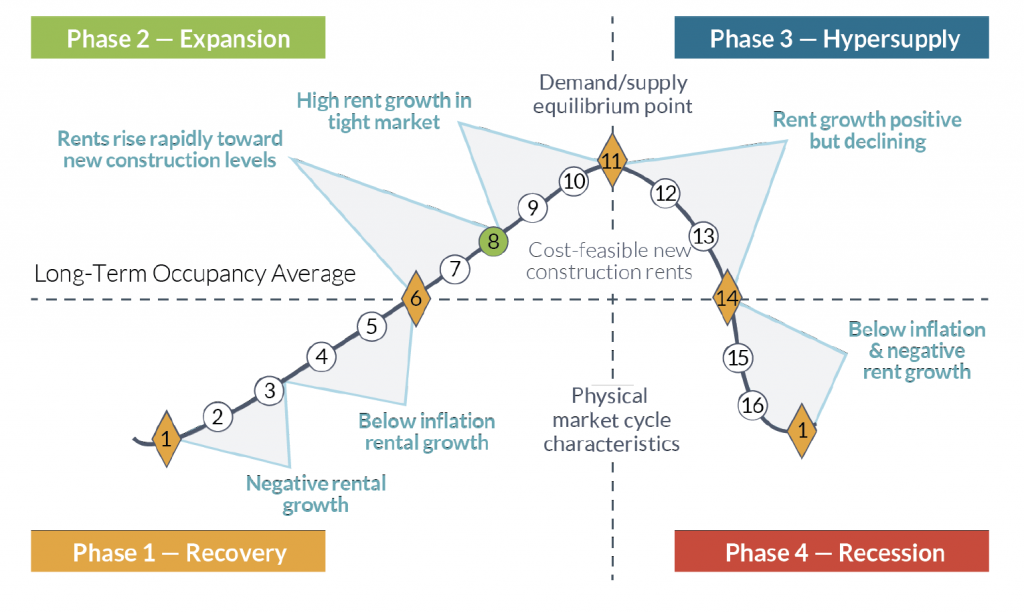
Rental growth rates can be characterised in different parts of the market cycle, as shown below.
Offices
The national office market occupancy level declined 0.5% in 4Q20 and was down 0.9% year-over-year. Many markets had occupancy declines pushing them closer to their long-term occupancy averages. The covid paradox continued to create ‘decision delay’ by many office tenants. Sublease space listings doubled in 2020 and many tenants with lease expirations extended leases short-term, as they tried to envision what a post-covid office environment and floor layouts might look like. Technology and internet sales companies expanded creating space demand, while other users made the decision to stay mainly work from home in the future. The size and magnitude of office demand is very much a guess until vaccination levels allow for a more normal in-office work environment. Average national rents decreased 0.2% in 4Q20 and produced a negative 1.1% asking rent decline year-over-year.
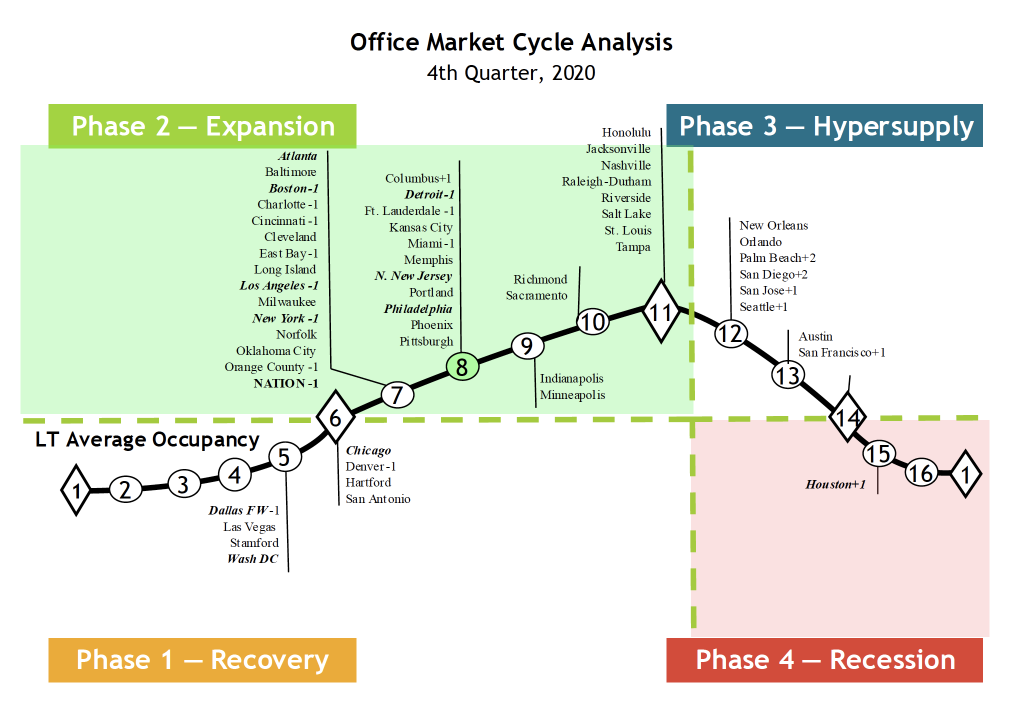
Note: The 11 largest office markets make up 50% of the total square footage of office space we monitor. Thus, the 11 largest office markets are in bold italic type to help distinguish how the weighted national average is affected. Markets that have moved since the previous quarter are now shown with a + or – symbol next to the market name and the number of positions the market has moved is also shown, i.e. +1, +2 or -1, -2. Markets do not always go through smooth forward-cycle movements and can regress or move backward in their cycle position when occupancy levels reverse their usual direction. This can happen when the marginal rate of change in demand increases (or declines) faster than originally estimated or if supply growth is stronger (or weaker) than originally estimated.
Industrial
Industrial occupancies increased 0.1% in 4Q20 but were down 0.3% year-over-year. Led by necessity goods producers and retailers, as well as logistics firms, leasing reached a new all-time high in 2020 of almost 900 million sq. ft. Unfortunately, delivery of new space slightly outpaced this highest demand, creating a small decline in occupancy. However, this oversupply was concentrated in R&D flex space that saw a negative 2 million sq. ft of net absorption, versus bulk warehouse that saw a positive 20 million sq. ft of net
absorption. Industrial national average rents increased 1.0 % in 4Q20 and increased 3.6% year-over-year.
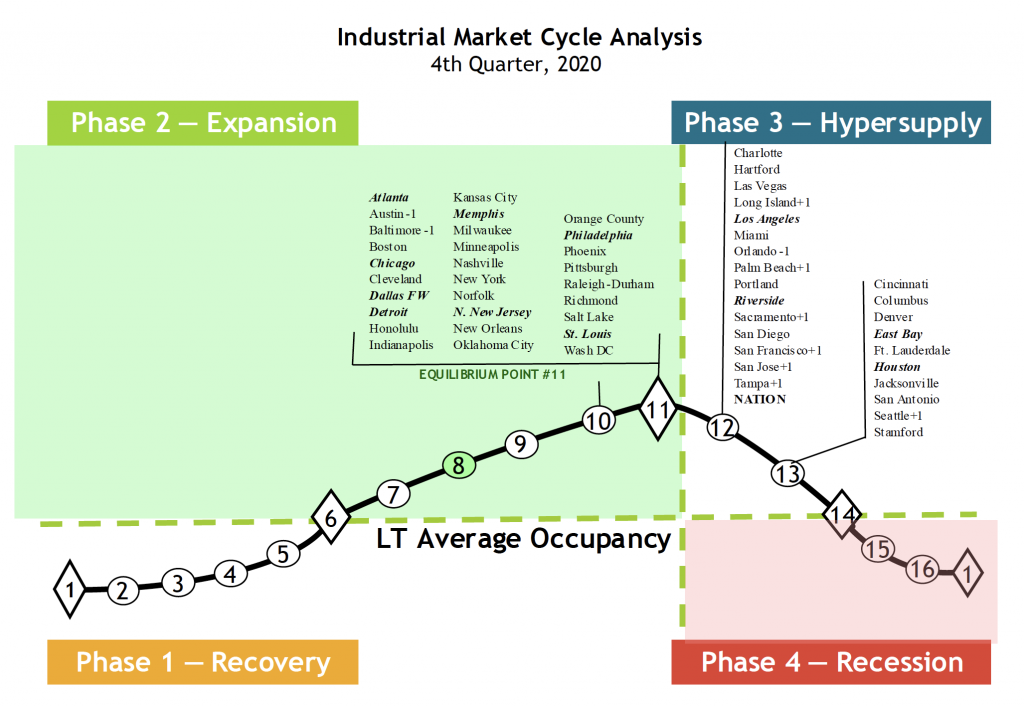
Note: The 12 largest industrial markets make up 50% of the total square footage of industrial space we monitor. Thus, the 12 largest industrial markets are in bold italic type to help distinguish how the weighted national average is affected. Markets that have moved since the previous quarter are now shown with a + or – symbol next to the market name and the number of positions the market has moved is also shown, i.e. +1, +2 or -1, -2. Markets do not always go through smooth forward-cycle movements and can regress or move backward in their cycle position when occupancy levels reverse their usual direction. This can happen when the marginal rate of change in demand increases (or declines) faster than originally estimated or if supply growth is stronger (or weaker) than originally estimated.
Apartments
The national apartment occupancy average declined 0.5% in 4Q20 and was down 1.4% year-over-year. Strong demand in the second half of the year created a record annual demand of 325,000 units. The over-supply of the last few years slowed as there were 150,000 fewer units supplied in 2020 than in the previous two years. There was a significant move out of major markets to second-tier markets, and urban net absorption declined by 50,000 units
across the US, while suburbs saw a 59% absorption increase with 270,000 units leased. Downtown rents dropped by 7% while suburban rents increased by 1%, leading to average national apartment rent growth being flat in 4Q20 and down 0.1% year-over-year.
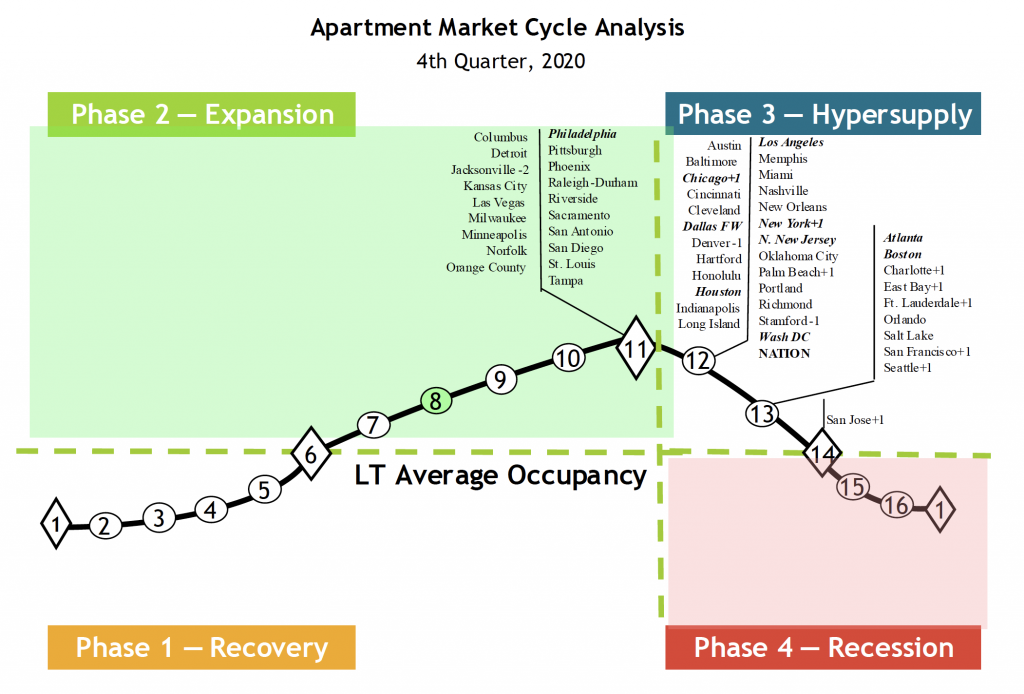
Note: The 10 largest apartment markets make up 50% of the total square footage of multi-family space we monitor. Thus, the 10 largest apartment markets are in bold italic type to help distinguish how the weighted national average is affected. Markets that have moved since the previous quarter are now shown with a + or – symbol next to the market name and the number of positions the market has moved is also shown, i.e. +1, +2 or -1, -2. Markets do not always go through smooth forward-cycle movements and can regress or move backward in their cycle position when occupancy levels reverse their usual direction. This can happen when the marginal rate of change in demand increases (or declines) faster than originally estimated or if supply growth is stronger (or weaker) than originally estimated.
Retail
Retail occupancies were down 0.3% in 4Q20 and were down 0.8% year-over-year. The covid ‘have-nots’, mainly restaurants, department stores and apparel stores, were the hardest hit, with many bankruptcies, store closures and space givebacks. These have-nots were the major contributors to the over 4 million sq. ft of negative net absorption in 4Q20. On the other hand, the covid ‘haves’, including grocers, home improvement/tools, general merchandise, discounters, pharmacies and pet stores, all grew sales and expanded their space leasing. National average retail asking rents decreased 0.4% for the quarter and were down 0.6%
year-over-year.
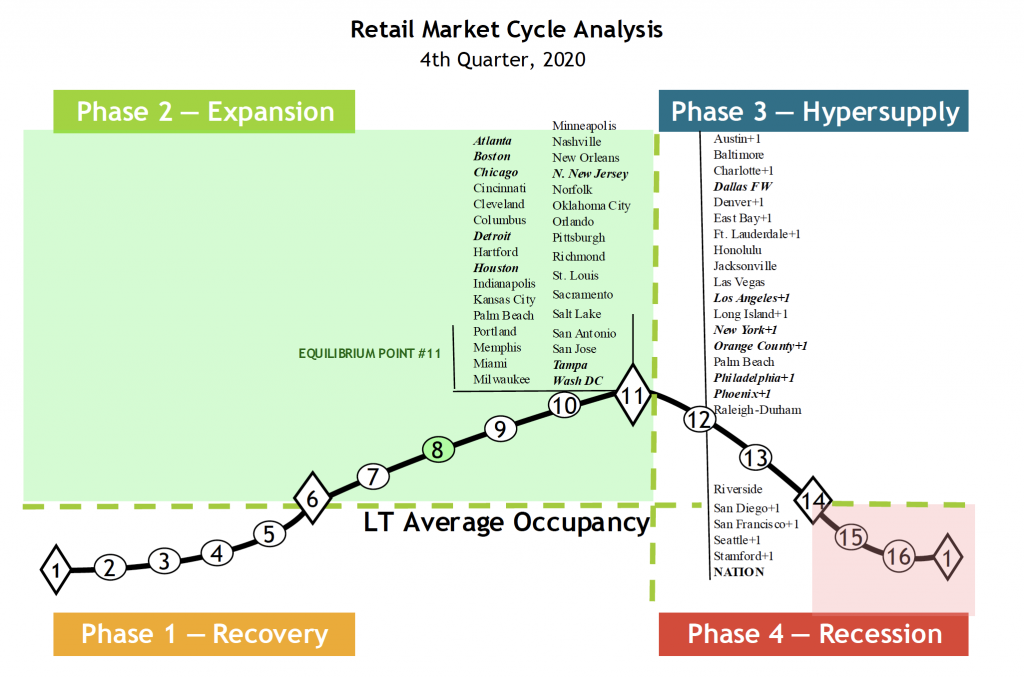
Note: The 14 largest retail markets make up 50% of the total square footage of retail space we monitor. Thus, the 14 largest retail markets are in bold italic type to help distinguish how the weighted national average is affected. Markets that have moved since the previous quarter are now shown with a + or – symbol next to the market name and the number of positions the market has moved is also shown, i.e. +1, +2 or -1, -2. Markets do not always go through smooth forward-cycle movements and can regress or move backward in their cycle position when occupancy levels reverse their usual direction. This can happen when the marginal rate of change in demand increases (or declines) faster than originally estimated or if supply growth is stronger (or weaker) than originally estimated.
Hotels
Hotel occupancy dropped substantially in 2020, with many hotels closing altogether. This drop would put all hotel markets at the bottom of their cycle, point #1 on the cycle chart.
Business and convention travel did not resume in any major way and leisure travel only returned to 50% of 2019 levels. It may easily be a few years before the leisure industry returns to normal and even more for business and convention travel is back to historic levels.
Data is no longer available from the normal source – thus, hotel coverage is suspended till further notice.
Market cycle analysis – explanation
Supply and demand interaction is important to understand. Starting in Recovery Phase I at the bottom of a cycle (see chart below), the marketplace is in a state of oversupply from either previous new construction or negative demand growth. At this bottom point, occupancy is at its trough. Typically, the market bottom occurs when the excess construction from the previous cycle stops. As the cycle bottom is passed, demand growth begins to slowly absorb the existing oversupply and supply growth is non-existent or very low. As excess space is absorbed, vacancy rates fall, allowing rental rates in the market to stabilise and even begin to increase. As this recovery phase continues, positive expectations about the market allow landlords to increase rents at a slow pace (typically at or below inflation). Eventually, each local market reaches its long-term occupancy average, whereby rental growth is equal to inflation.
In Expansion Phase II, demand growth continues at increasing levels, creating a need for additional space. As vacancy rates fall below the long-term occupancy average, signalling that supply is tightening in the marketplace, rents begin to rise rapidly until they reach a cost-feasible level that allows new construction to commence. In this period of tight supply, rapid rental growth can be experienced, which some observers call ‘rent spikes’. (Some developers may also begin speculative construction in anticipation of cost-feasible rents if they are able to obtain financing.) Once cost-feasible rents are achieved in the marketplace, demand growth is still ahead of supply growth – a lag in providing new space due to the time to construct. Long expansionary periods are possible and many historical real estate cycles show that the overall upcycle is a slow, long-term uphill climb. As long as demand growth rates are higher than supply growth rates, vacancy rates should continue to fall. The cycle peak point is where demand and supply are growing at the same rate or equilibrium. Before equilibrium, demand grows faster than supply; after equilibrium, supply grows faster than demand.
Hypersupply Phase III of the real estate cycle commences after the peak/equilibrium point #11 — where demand growth equals supply growth. Most real estate participants do not recognise this peak/equilibrium’s passing, as occupancy rates are at their highest and well above long-term averages, a strong and tight market. During Phase III, supply growth is higher than demand growth (hypersupply), causing vacancy rates to rise back towards the long-term occupancy average. While there is no painful oversupply during this period, new supply completions compete for tenants in the marketplace. As more space is delivered to the market, rental growth slows. Eventually, market participants realise that the market has turned down and commitments to new construction should slow or stop. If new supply grows faster than demand once the long-term occupancy average is passed, the market falls into Phase IV.
Recession Phase IV begins as the market moves past the long-term occupancy average with high supply growth and low or negative demand growth. The extent of the market down-cycle is determined by the difference (excess) between the market supply growth and demand growth. (Massive oversupply, coupled with negative demand growth that started when the market passed through long-term occupancy average in 1984, sent most US office markets into the largest down-cycle ever experienced.) During Phase IV, landlords realise that they could quickly lose market share if their rental rates are not competitive. As a result, they then lower rents to capture tenants, even if only to cover their buildings’ fixed expenses. Market liquidity is also low or non-existent in this phase, as the bid-ask spread in property prices is too wide. The cycle eventually reaches bottom as new construction and completions cease, or as demand growth turns up and begins to grow at rates higher than that of new supply added to the marketplace.
This research currently monitors five property types in 54 major markets. We gather data from numerous sources to evaluate and forecast market movements. The market cycle model we developed looks at the interaction of supply and demand to estimate future vacancy and rental rates. Our individual market models are combined to create a national average model for all US markets. This model examines the current cycle locations for each property type and can be used for asset allocation and acquisition decisions.
Contact: glenn.mueller@du.edu


