


Originally published March 2022.
UK house prices have been in a bubble for almost 20 years, which makes it one of the longest-running bubbles in history.
This is very interesting, because bubbles almost never last this long. They usually only last a few years and every bubble in history has ended when the temporary factors that inflated it came to an end.
So will the UK house price bubble be the first in history to last forever or will it end just as all other bubbles have ended?
To begin to answer that, we need to step back to look at the big picture.
UK house prices have increased massively over the past 60 years
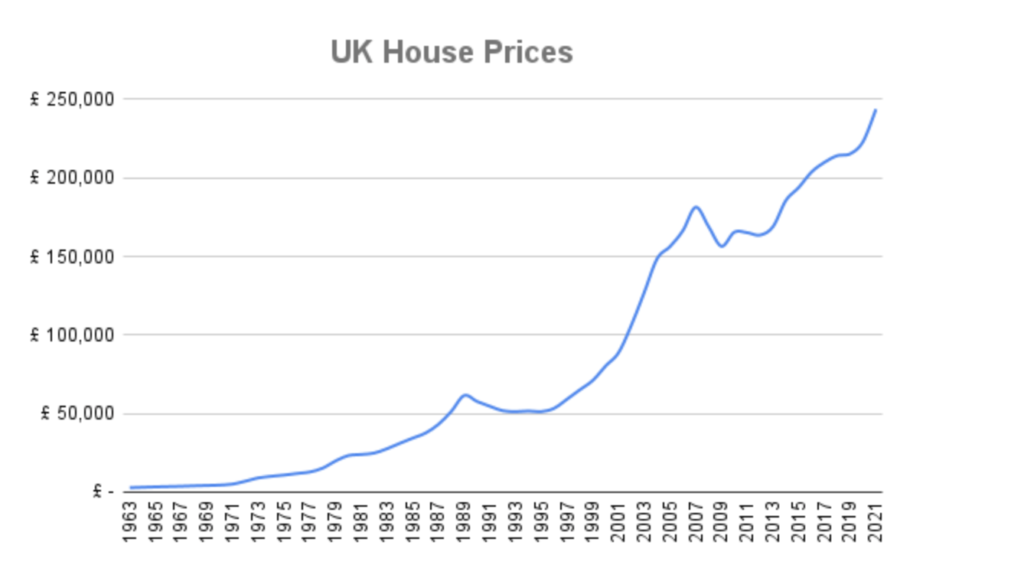
UK house prices have gone up almost every year for most of the past 60 years.
Here are some pretty impressive stats:
- In 1963, the average UK house cost less than £3,000
- By the end of the inflationary 1970s, the average house cost £23,000
- The housing boom of the late 1980s drove the average price up to £61,000
- The first leg of the current housing bubble took it to £181,000 in 2007 and…
- today the average UK home costs around £250,000
That’s an incredible 8,500% gain in house prices since 1963, which works out at about 8% per year.
No wonder so many people expect house prices to keep going up by 5% or even 10% every year.
But it takes more than rising prices to create a bubble.
Prices are only in a bubble if they’re unsustainably high and when it comes to housing, high means high relative to wages. So let’s have a look at the relationship between average house prices and average wages.
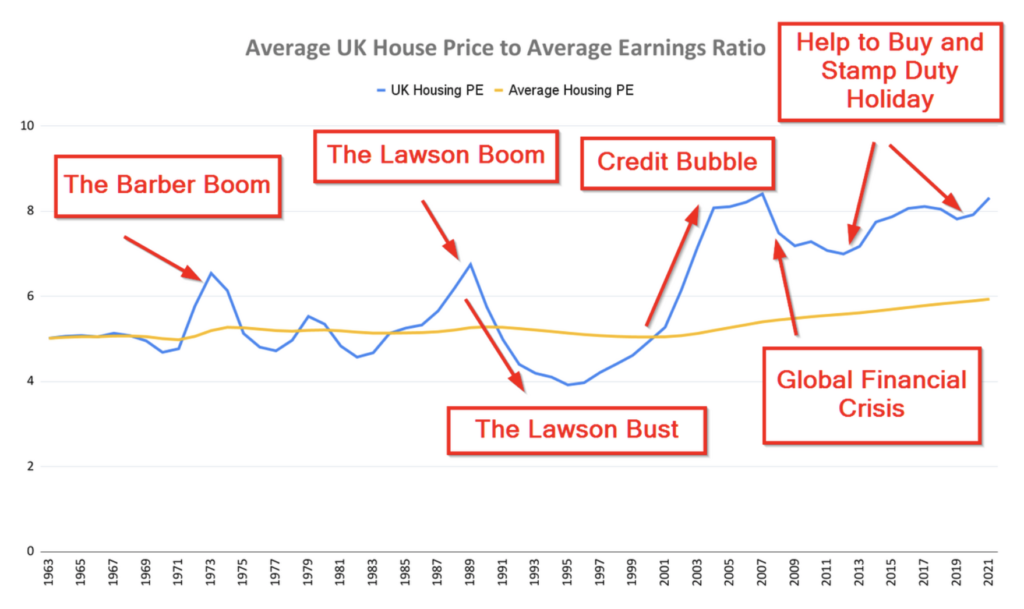
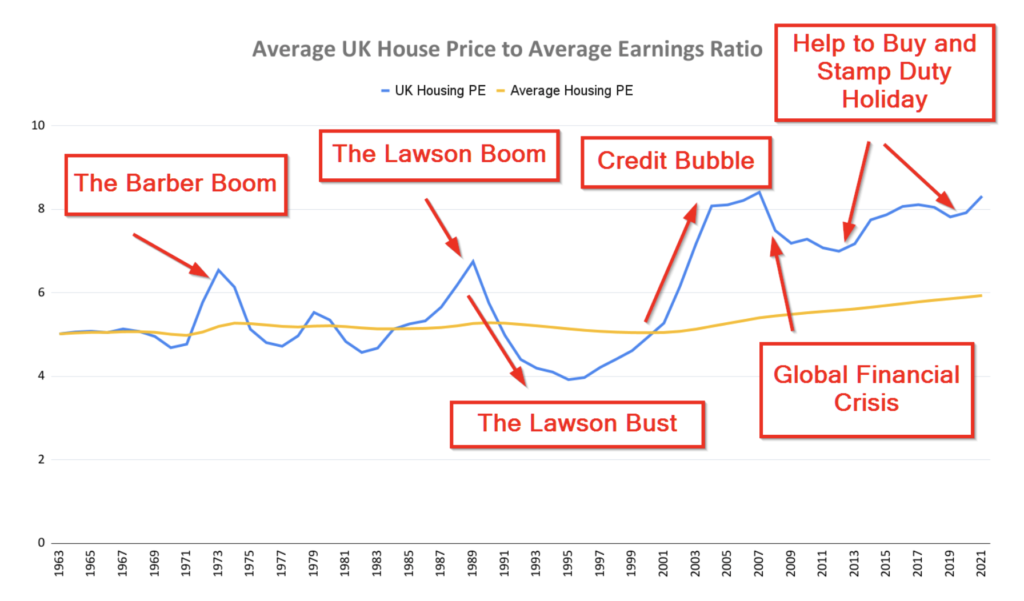
The price-earnings ratio says UK house prices are in a bubble
The obvious thing to do with house prices and wages is to look at the ratio between them, which is known as the house price-earnings ratio.
The key feature of the house price-earnings ratio is that it should be mean-reverting. In other words, when the ratio moves far above or below its long-run average (mean), we should expect it to revert back towards that average.
That’s the theory at least, and we can check that theory against reality by looking at how the UK house price-earnings ratio has varied over the past 60 years.
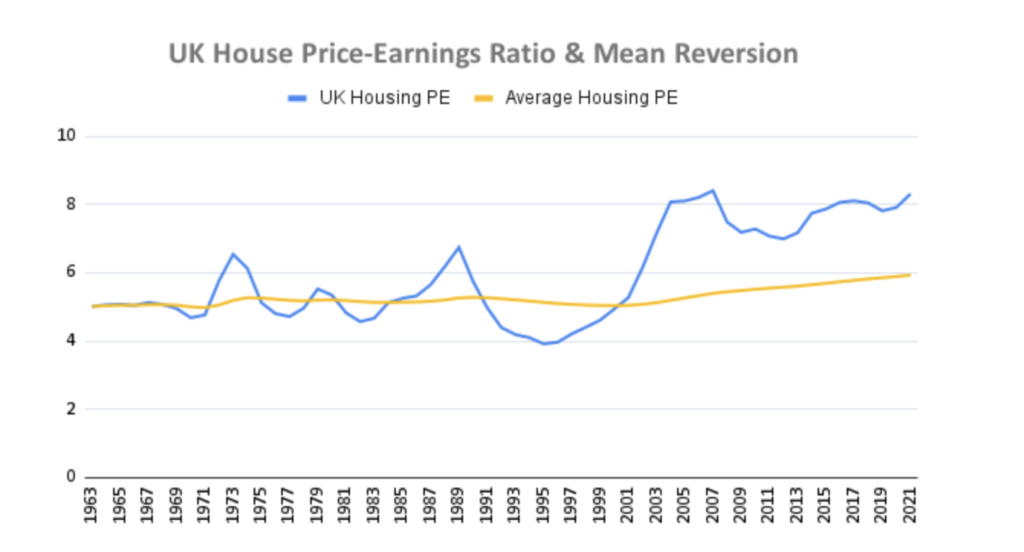
During the 40-year period from 1963 to 2003, the mean reversion argument seems to hold.
The average person was willing to pay somewhere between four and six times their annual earnings to buy the average home and for most of that period, the ratio was fairly close to its average of around five-times earnings.
During those 40 years, when the average house was priced at more than six times earnings, they were too expensive for most people. This reduced demand and house prices fell back towards the long-run average, as they did after the late 1980s housing bubble.
When the average house was priced at four-times earnings in the mid-1990s, houses were cheap and that increased both demand and prices.
This simple interaction between prices and demand is what drives mean reversion.
But after 2003, the house price-earnings ratio moved up to a new range of between seven and nine-times earnings.
According to the mean-reversion model, UK house prices have been in a bubble since 2003 and, at some point, we should expect the ratio to revert to its long-term average of five-times earnings.
In other words, we should expect house prices to decline by around 40% relative to earnings.
Most people will laugh at the mere suggestion of such a decline. But rather than dismiss the possibility out of hand, we should look at the factors that inflated this bubble to see if they can be sustained indefinitely.
Bubble factor 1: ultra-low interest rates
Mortgage interest rates obviously have a significant influence on house prices. But like most things in the real world, the relationship between mortgage rates and house prices is messy.
Mortgage interest rates obviously have a significant influence on house prices. But like most things in the real world, the relationship between mortgage rates and house prices is messy.
Here’s a chart that layers mortgage rates on top of the housing PE ratio so we can see what sort of relationship there is, if any.
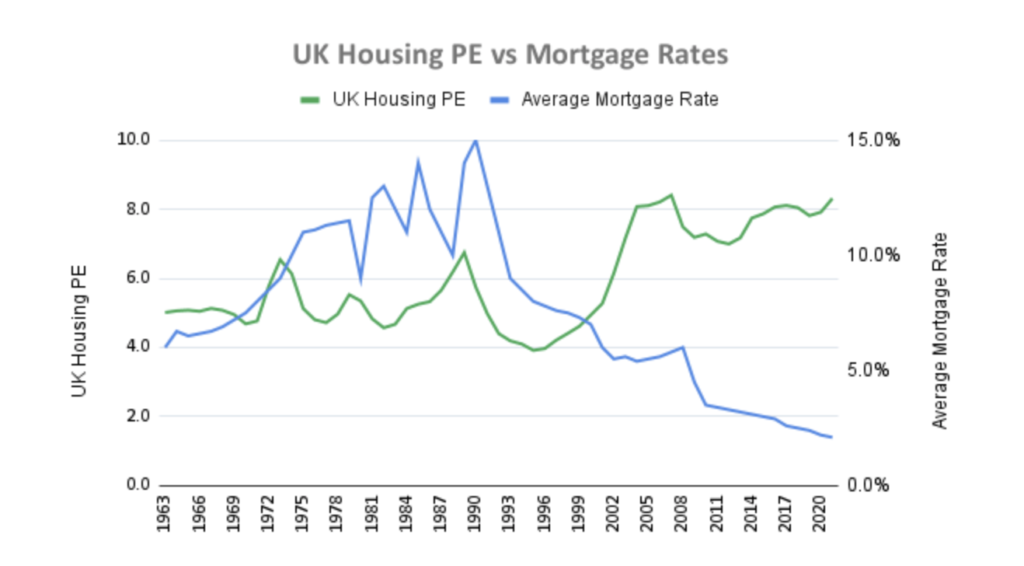
Here’s a brief description of the events underlying the above chart:
- Through the 1960s and 1970s, house prices were mostly at historically normal levels relative to earnings. There was a brief housing bubble around 1973 (the Barber Boom), but it was killed off by the oil crisis.
- In the late 1980s, the UK had its first full-on property bubble. The housing PE reached 6.7, but this bubble was short-lived and came to a sticky end when mortgage rates jumped to 15%. The combination of high prices and high mortgage rates made the average house unaffordable and this caused a house price crash.
- The house price crash dragged on until the mid-1990s, leaving the average house cheap at just four-times earnings. Mortgage rates also fell and this made houses unusually affordable. Demand and prices began to increase once more.
- Interest rates continued to fall through the late 1990s as cheap goods from China drove down inflation. In 2003, the Bank of England cut interest rates to a historically low 3.5%. Low mortgage rates made houses relatively affordable even though the housing PE ratio was already on the high side. This is the point where the UK housing market moved from being expensive to being in a bubble.
- In 2007, the house price-earnings ratio reached an all-time high of 8.4, more than twice the level of the mid-1990s. This was clearly an unsustainable bubble that was fuelled by reckless lending by banks and other mortgage providers. This phase of the bubble ended when the global banking system collapsed and had to be bailed out by governments across the world.
- In response to the financial crisis, the Bank of England cut interest rates to a multi-century low of 1% and has kept them at that level or less ever since. In response, mortgage rates have continued to fall to record lows (the average mortgage rate today is just 2%) and this has allowed the bubble to remain inflated for almost 20 years.
So super-low interest rates are the main cause of this bubble, but can super-low interest rates be sustained in order to keep this bubble inflated forever?
I think the answer is no. Here’s why:
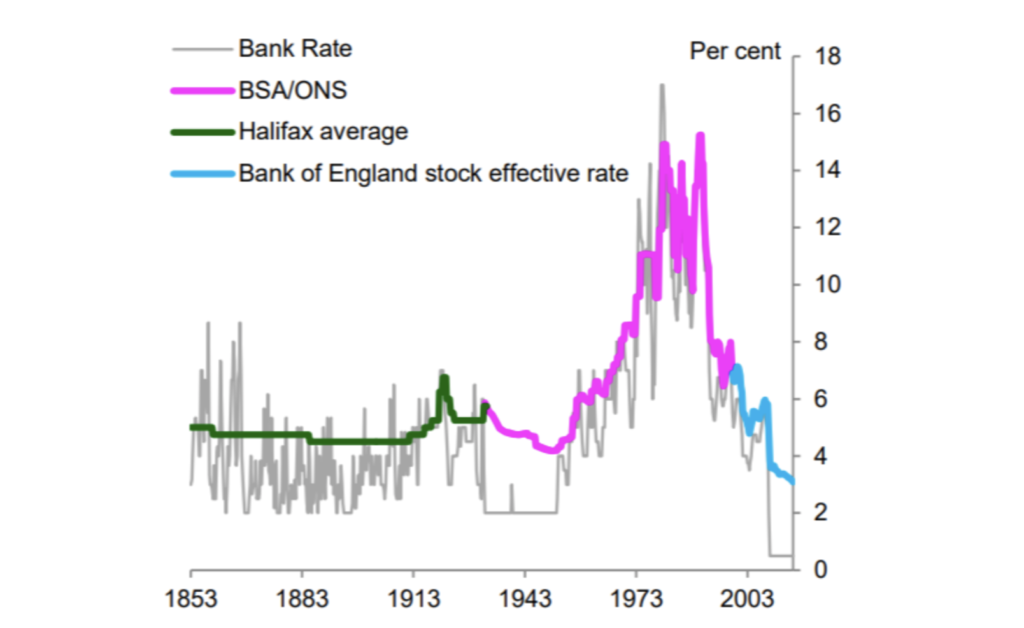
For most of the last 5,000 years, global interest rates have been around 4-5%. Over more than 300 years, the official UK interest rate has averaged 5%. Since 1853, UK mortgage rates (the thick green, pink and blue line in the chart above) have spent most of their time close to 5%.
In other words, if centuries of history are anything to go by, interest rates are likely to return to 4% or 5% at some point in the future.
The current super-low interest rate environment has lasted 13 years and is historically unprecedented. It could easily last another decade, but with UK inflation currently running at well over 5%, we could just as easily see interest rates at 3%, 4% or even 5% sooner than most people think.
So super-low mortgage rates are a key driver of this housing bubble, but it’s very unlikely that they’re sustainable.
However, it takes more than cheap mortgages to inflate a bubble. What you really need is a speculative mania.
Bubble factor 2: the madness of crowds
Humans love to extrapolate past events into the future. It’s an incredibly useful mental shortcut that we all use, all of the time.
But this mental shortcut often does us more harm than good when it comes to investing.
Why? Because if share prices or house prices have been going up for long enough without a crash, people will start to believe that prices will always go up and will never crash again.
This belief is usually strongest in young people, because share prices or house prices may have been going up for most of their life.
After all, the last house price crash in the UK was in the early 1990s. That’s 30 years ago, so pretty much anyone under the age of 50 didn’t own a house during the last crash, and most of them weren’t even born.
This misplaced belief in ever-rising prices is the rocket fuel that takes markets from expensive to delusional.
Just think about it. If you think house prices are always going to go up faster than your wages, what do you do if you want to buy a house?
You save as hard and as fast as you can (or pester the Bank of Mum and Dad as much as you can) and you try desperately to buy a home before prices move out of reach.
If you have to pay 10-times earnings, so be it. If you have to borrow so much that all you can afford to eat is beans on toast, so be it. Because if you don’t buy a house now, you believe, you’ll never be able to afford one in a few years.
In other words:
An expectation of endless price increases drives an insatiable desire to buy at any price, because the price today is always expected to be more affordable than the price tomorrow.
In addition, we’ve had a multi-decade speculative boom in buy-to-lets, where every other hairdresser owns 17 houses and every other programme on TV is about climbing the property ladder.
So most Brits are suffering from a near-unshakable belief that house prices will always go up and that buying a house is always a good investment at any price.
But is this blind optimism about future house price growth sustainable?
I think the answer is no.
At some point, optimism pushes prices up to the point where nobody else can afford to buy. Everyone who doesn’t already own a house is literally priced out of the market because they simply cannot save or borrow enough to pay a deposit on a garden shed, let alone a one-bed flat.
And that’s exactly what happened after the financial crisis.
After the credit crunch, banks were forced to improve their lending standards. They stopped dishing out loans to NINJAs (no income, no job, no assets) and they started requiring a deposit of at least 10% (and in many cases much more).
The minimum deposit on the average house went from £10,000 to £20,000 and since most people in their 20s or even 30s don’t have anything like that much in savings, the number of buyers dried up and the average UK house price went nowhere from 2006 to 2012.
This caused the house price-earnings ratio to decline from 8.4 in 2007 to 7.0 in 2012, a 17% decline relative to earnings.
In a remotely sane world that would have been the end game for this particular bubble and house prices would have continued to decline relative to earnings, perhaps reaching five-times earnings by 2020.
But that isn’t what happened.
Instead, the government sprang into action because falling house prices are not a vote-winner.
Bubble factor 3: a government obsessed with house prices
If you want to inflate a financial bubble, what do you do? You throw a wall of money at it.
So that’s what the government did, by conjuring up a variety of idiotic schemes from Help to Buy to the Lifetime ISA. These were designed to suck new buyers into the market by subsidising property with money taken from taxpayers (many of whom have no chance of affording their own homes).
And it worked like a charm. House prices returned to growth and by 2016, the average house had increased by almost £40,000 to £200,000.
As if that wasn’t enough, the government then needlessly suspended stamp duty during the pandemic, pouring yet more petrol onto this already blazing bubble, driving the average house price up almost 10% in a single year to £250,000.
So the second leg of this near-20-year bubble, from 2013 to 2022, has been driven largely by government decisions specifically designed to re-inflate the housing bubble.
But, once again, the key question: Can the government sustain this bubble indefinitely?
Although the government does have enormous power and access to enormous amounts of taxpayer money, I still think the answer is no.
If the government subsidises house prices via Help to Buy or any similarly idiotic scheme, all that will do is push prices up even further.
As prices go up, people will eventually be priced out even with the subsidy. The only way to drive prices ever higher through subsidy is to continually increase the subsidy. But, of course, this is impossible because at some point the tax burden would become economically or politically unsustainable.
So at some point, these government schemes are likely to stall, shrink or, preferably, vanish. At that point, the bubble would lose this temporary inflating factor.
Is the end nigh for the UK’s longest housing bubble?
To sum all that up, the current UK housing bubble has lasted almost 20 years, thanks to a combination of record-low interest rates, excessive optimism about future house price growth and governments hell-bent on driving house prices upwards at all costs.
But these are all likely to be temporary factors and, in my opinion, this bubble will inevitably end, just as all bubbles in history have ended.
Exactly what will bring it to an end, and when, is impossible to know, but the impending cost of living crisis will be a serious test of this bubble’s fortitude.
And if the cost of living crisis doesn’t kill this bubble, something else will.
I think the best we can hope for is an orderly decline of house prices relative to wages, back to something like four, five or even six-times earnings. If that happened over a decade (perhaps returning to normal levels by 2030) the UK might be able to avoid the worst effects of a more abrupt house price crash.
Originally published by UKDividendStocks.com and reprinted here with permission.


