


Since the market crash of 2008/2009, The FTSE 100 and S&P 500 have produced very different results. Some of this is down to fundamental factors such as differences in revenue, earnings and dividend growth, but much of it is down to sentiment and valuation ratios.
For example, investors have been wary of the FTSE 100 over the last few years because of the eurozone crisis and Brexit. As a result, FTSE 100 valuations have remained relatively low compared to historic norms.
More specifically, the FTSE 100’s CAPE ratio (the ratio of price to ten-year inflation adjusted earnings) has been below average ever since the crash of 2008/2009.
In keeping with these low valuations, the FTSE 100 entered 2020 at a price of 7,450 and with a CAPE ratio of 15.6, slightly below its long-term average of 16.
When the world ran into a global pandemic the stock market reacted exactly as an experienced investor would expect: Fear and panic led to a record-breaking collapse of share prices, followed by a quick rebound driven by a more pragmatic revaluation of long-term expectations.
At the moment of maximum panic (March 23rd) the FTSE 100 fell below 5,000, a level it first reached in August 1997, almost 23 years ago.
With the FTSE 100 at 5,000 in March, that gave the UK large-cap index a CAPE ratio of 10.3. That’s significantly below its average of 16, implying that the FTSE 100 was probably very good value at that price, precisely because so many investors didn’t want to touch the UK with a bargepole.
To put that into context, I’ve included a chart of FTSE 100’s actual price through the first half of 2020 along with the spectrum of values it would have had at various historically achievable valuation (CAPE) ratios.
The range of potential values extends from half to double the long-term average CAPE of 16, going from very cheap (shown in green, when CAPE is around 8) to very expensive (shown in red, when CAPE is around 32).
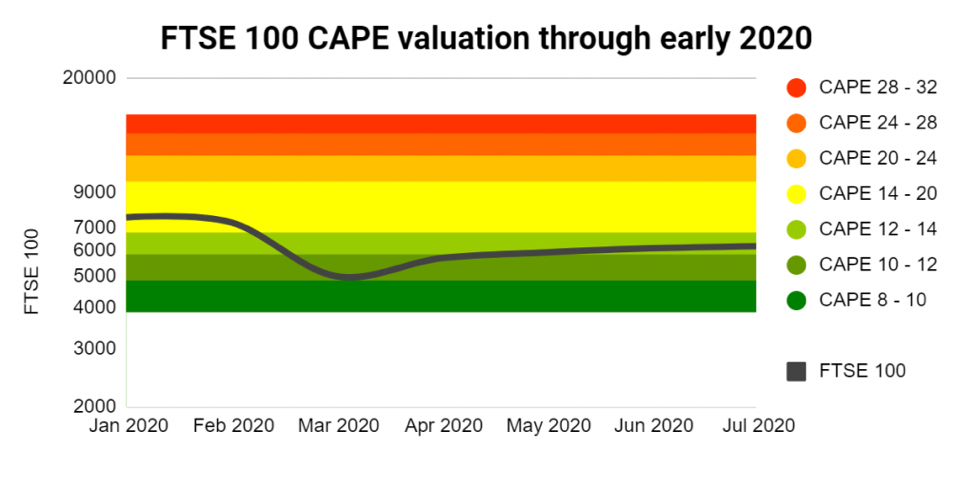
GREEN = cheap, YELLOW = fair value, RED = expensive
The chart shows that the FTSE 100 entered 2020 at a fairly normal valuation, but as investors panicked its price fell towards the bottom end of that valuation spectrum. The implication is that at 5,000 the index was cheap, with little downside valuation risk and much upside potential.
Another way to think about valuation is with earnings yields rather than PE ratios, and a CAPE ratio of 10.3 is equivalent to a cyclically adjusted earnings yield of 9.7%. Or you might prefer to look at dividend yields, in which case the FTSE 100’s dividend yield at 5,000 was 6.6%. Either way, those are some very attractive yields.
In other words, in March, at the moment of peak fear, the FTSE 100 seemed to offer very good value.
So what happened after March? The market rebounded and as I write the FTSE 100 has recovered to more than 6,000. That’s a return of more than 20% in just four months from what is a relatively low risk equity investment.
The fact that the market rebounded will not come as a surprise to value investors. After all, the fundamental principle of value investing is that low valuations (such as those in March) tend to be followed by high returns, while high valuations (think dot com bubble in 1999) tend to be followed by low returns.
Despite much gnashing of teeth in recent months and years over whether value investing still works, the fundamental principle of buy low and sell high has not changed one tiny bit.
So where does the FTSE 100 go from here? Nobody knows for sure, but at its current price of 6,000 the FTSE 100 has a CAPE ratio of 12.4, which is 23% below its long-term average of 16. If the index rose to fair value overnight (the price at which its CAPE equals its historic average), it would grow by almost 30% and reach 7,750.
As for the S&P 500, the story is very different.
Unlike the FTSE 100’s weak returns in recent years, the S&P 500 has produced a near five-fold increase between the credit crunch of 2009 and its pre-pandemic all time high in early 2020.
After that record breaking ten-year run, the S&P 500 entered 2020 at an all time high of 3,260, a miraculous feat of expansion from its 2009 low of 666.
Through early 2020 the S&P 500 just kept on growing, reaching an all time high of almost 3,400 in February. At that price the S&P 500 had a CAPE ratio of almost 32, which is nearly 80% above its 100-year average CAPE ratio of 18.
And then the pandemic panic began, wiping 35% off the US large-cap index in just a few weeks.
35% sounds like a big fall, but given the S&P 500’s lofty starting valuation it wasn’t even enough to take the index back to “fair value”, let alone anything that could be called cheap.
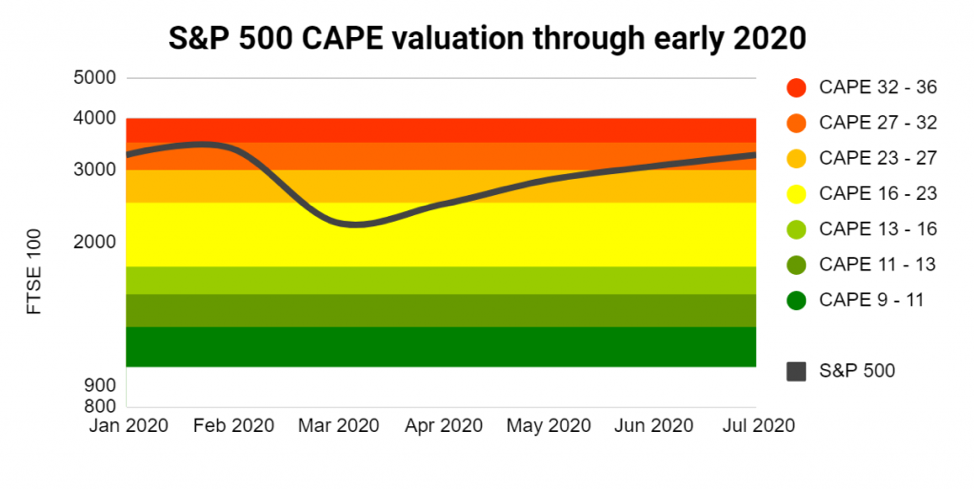
I’ve included an S&P 500 chart showing how the US large-cap index came into 2020 at very high valuations, fell to almost normal valuations during the panic and then exploded back upwards to high valuations. In fact, in recent days it’s come within a few points of setting a new all time high.
Given that we’re in the middle of a global pandemic, with thousands of companies on the brink of collapse, I think this shows an astonishing degree of optimism, inexperience or foolishness (I’m not sure which).
This apparent disconnect between US stock market valuations and global economic conditions has led some notable investors to the conclusion that the US is very likely in a 24 carat solid gold stock market bubble.
Quoting someone who is considerably smarter than me:
“My confidence is rising quite rapidly that this is, in fact, becoming the fourth, real McCoy, bubble of my investment career. The great bubbles can go on a long time and inflict a lot of pain but at least I think we know now that we’re in one. And the chutzpah involved in having a bubble at a time of massive economic and financial uncertainty is substantial.”
Jeremy Grantham, billionaire value investor in an interview with CNBC
I’m not sure I’d call this a bubble just yet, but from a CAPE valuation point of view the S&P 500 is definitely in the expensive zone, which is very surprising given the extreme levels of uncertainty. And if the pandemic does take a sledgehammer to earnings over the next couple of years then yes, the US could already be a full blown bubble.
However, I’m not saying investors should exit the US market. But, if their allocation to US stocks has increased because of the US bull market, they might want to think about rebalancing their asset allocations back to target levels.


