


In 2005, futurist Ray Kurzweil shocked the world with his book, The Singularity is Near. He speculated that around the year 2045, the Singularity, which is to say a humanity which has merged with technology, will turn artificial intelligence (AI) into pure energy and saturate the universe at, or beyond, the speed of light. Central bankers, for their part, have been working on a parallel project: to use imaginary intelligence (II) to collapse all financial asset prices onto each other to create a single composite price series and saturate the financial universe. Their actions, intentionally or otherwise, have at times raised the correlation coefficients between the prices of different financial assets to extraordinary heights, if not quite 100%.
Appropriately for the season of Epiphany, when wise men followed a star, there is one chart that has captivated the attention of wise and not-so-wise men and women in these early days of 2018. It is the time series chart of the yield on 10-year US Treasuries (figure 1). In this chart is captured, for economists, financial analysis, and asset managers alike, ‘the hopes and fears of all the years’.
Figure 1
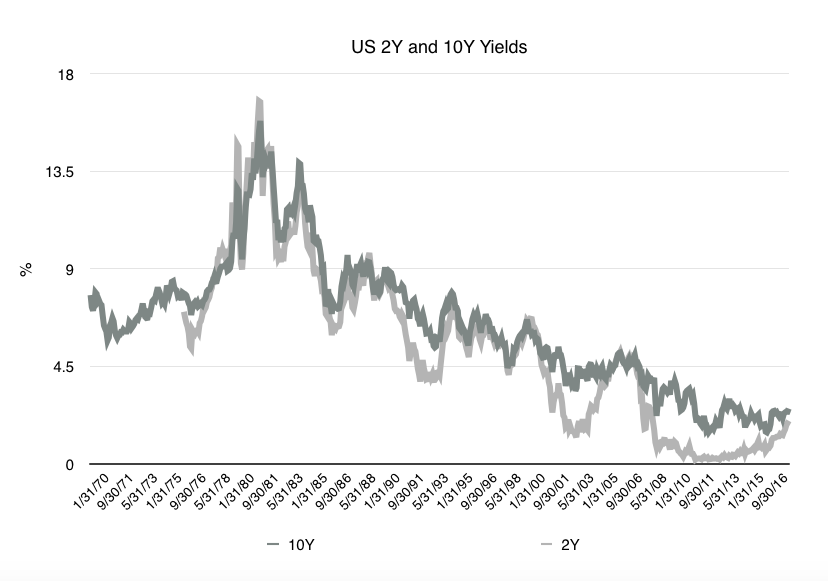
Source: Reuters Eikon Datastream
Allow me to explain. At the end of the chaotic and inflationary 1970s, western governments finally decided to attempt to restore order to their domestic financial affairs. Having long relied on the US to provide leadership in economic and financial management – imported via a fixed exchange rate to the US dollar, until Bretton Woods fell apart in 1971 – the developed nations of Europe and Asia realised that they must now assume this responsibility themselves. The US itself needed the harsh discipline of monetary restraint, administered by one Paul Volcker. This meant the taming of government budget deficits and of periodic adventurism by domestic banks.
As painful lessons of economic management were learnt – or re-learnt – inflation rates tumbled and the cost of government borrowing came crashing down in the 1980s, albeit with some erratic episodes along the way. A bull market in fixed securities was born that has matured into the fully developed monstrosity that we observe today. The issue at hand is whether this bull market can eke out a few more months or even years, or whether its end is nigh. Indeed, this is a market that has been obituarised on a regular basis for at least 10 years. Technical analysts vie with each other to determine the precise thresholds that must be breached for the time of death to be announced.
Bill Sarubbi, Forbes (11th January edition) proclaims that ‘The Bond Bear is Here’, marking the turn in 2016. Bill Gross, in his latest Investment Outlook for Janus Henderson, believes that ‘we have begun a bear market although not a dangerous one for bond investors. Annual returns should still likely be positive, although marginally so.’ Ambrose Evans-Pritchard, writing for the Daily Telegraph and living up to his reputation as an iconoclast, quotes the advice of Louise Yamada, Wall Street’s celebrated technical analyst, ‘to get out of all bonds with a duration above two years. Anything longer will see an erosion of capital value. Those who hold on – or who are pushed into bonds by their pension funds – will suffer a relentless loss of real wealth.’
It is easy to dismiss such bold projections as mere marketing exercises, but unfortunately there are substantial arguments that give credibility to such a shocking outlook. First, there has been a meaningful quickening in the growth pace of nominal spending and incomes in the world economy. As so often, China has contributed materially to this development, but it is reflected in at least another 30 of the 50 largest countries. Faster nominal growth in the global economy infers that the equities of large diversified companies will tend to outperform those of fixed interest investments. Second, you would have needed to have spent Christmas in a very secluded location indeed to be unaware that the US Federal Reserve is dribbling Treasury bonds back into the market and the European Central Bank has recently halved the size of its bond purchase programme. The Bank of Japan has also quietly wound down its own version of quantitative easing. Third, US Congress has approved a tax reforming Budget that will add to the fiscal burden and the requirement for primary debt issuance. This, in an economy already suffering from acute supply bottlenecks and skill shortages. (As an aside, a third of adult Americans now have a criminal record – which makes more sense of the huge number of hard-to-fill vacancies.)
This debate around the outlook for US – and by extension, European – bonds has obvious relevance to property investors. The backing up of bond yields – which has occurred to an even greater extent in 2-year bonds – affects the pricing of top tier property assets and the prospective profitability of all future investments financed by debt.
After the equity price collapse in 2000, many private investors vowed that they would never again allow themselves to be duped by investment advisers into buying stocks. (Remember the wisdom of Peter Cook: ‘I have learned from my mistakes and I am sure I can repeat them exactly.’) Property assets were a major beneficiary of this new-found risk aversion and it is time to wonder whether the vulnerability of government – and corporate – bonds will send investors flocking towards managed property assets as fixed interest subsidies.
An intriguing paper, entitled ‘The Rate of Return on Everything’, appeared on the San Francisco Fed’s website just before the turn of the year. The new study, covering 16 countries, begins in 1870 and includes returns for domestic real estate for the first time. Given that housing wealth constitutes around half of national wealth in a typical economy, this is a significant step forward. The banner headline from this work is that the average real returns on global housing and global equities have been quite similar, both for the full sample and for the post-1950 sub-sample (see figure 2). The difference is that equities have a standard deviation (variability) that is more than twice as large as that of housing, prompting the thought that ideally, investors should be even more desirous of an internationally diversified portfolio of real estate holdings than of equities.
Figure 2
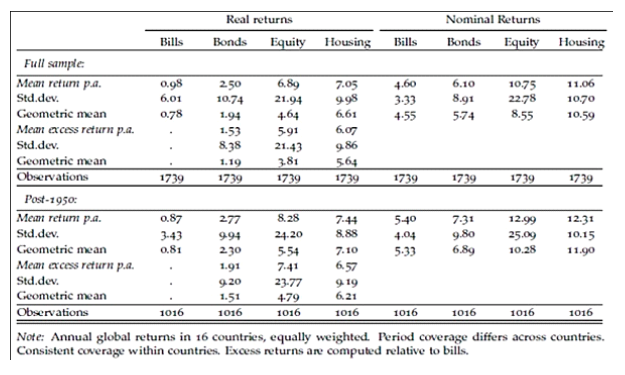
Source: San Francisco Federal Reserve
Indeed, housing delivers superior returns to government bonds for a similar degree of volatility. What the authors discover is that the so-called ‘safe’ assets – bonds and bills (cash) – have delivered a combination of low returns and high volatility. Moreover, the volatility of the risk premium of ‘risky’ (housing and equities) over ‘safe’ (bonds and bills) is attributable more to variations in returns to safe assets than to risky ones. If we take the results at face value, asset managers should reallocate heavily to international residential property, notwithstanding its illiquidity.
Could it be that this is already happening? While residential property ownership remains predominantly direct, the growth of international commercial property funds is impressive. CBRE asset management, one of the largest global real estate funds, has almost US$100bn under management. As individuals are deterred by punitive tax regimes and quotas for direct international property investment, perhaps we will see an aggressive expansion of residential property fund management. As is often the case, once reliable benchmark data exists, indexes are created and portfolios constructed. What would provoke such a shift in asset allocation? Why, a sharp drawdown in global bond – and equity – prices.


