


After lumbering around the $1trn-$2trn assets under management mark for quite some time, central bank policies in the wake of the global financial crisis were a long-awaited shot in the arm for the private capital industry.
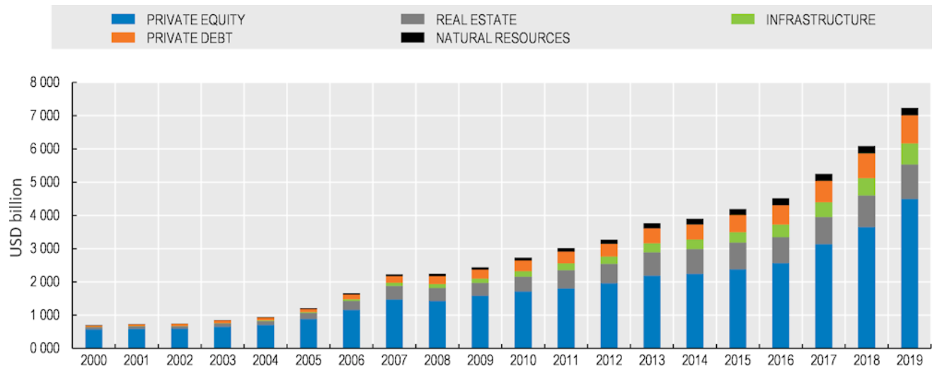
Faced with diminishing returns in traditional 60:40 portfolios, institutional investors started to look for a bit more action. Along came private equity. Between 2008 and 2019, PE assets under management volumes more than tripled to $7trn.
Private capital assets under management by asset class, 2000-19
Did capital allocators simply stumble on the ‘holy grail’ of PE investing?
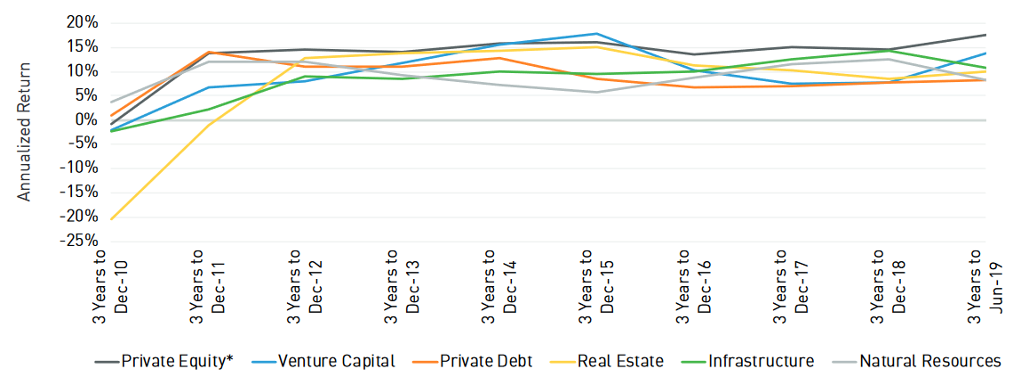
Well, they had a little help. AUM league tables and smooth double-digit IRR data for non-listed assets helpfully provided by globetrotting marketing teams of large fund managers were simply too appealing to be ignored by capital allocators tasked with lofty return targets.
Rolling three-year horizon IRRs by asset class
So, is the story of stellar AUM growth and smooth returns just a self-fulfilling prophecy or are we missing something?
Keeping in mind a Buffet phrase from his 1994 Omaha pilgrimage – “Don’t ask the barber whether you need a haircut” – let’s look at some of the alternative arguments brought forward by the academic community.
Let’s start with a simple observation: An IRR does not measure risk. It measures the discount factor for a series of cash flows to arrive at a net present value of zero.
Well, so if they don’t measure risk, do IRRs at least measure non-risk-adjusted performance?
Well, they do, as long as the capital structures are comparable, which is rarely the case. It’s also imperative to keep in mind that IRRs are highly ‘manageable’ using leverage and cash-flow timing as illustrated in the following simplified scenarios:
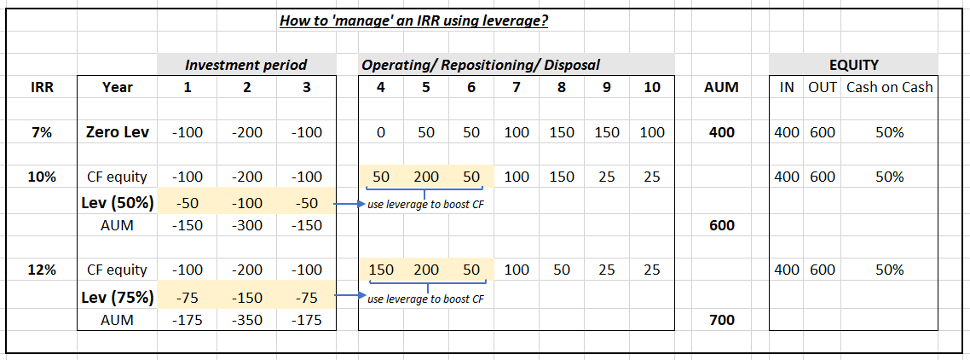
In all three cases, an investor contributes 400 units of equity to an investment fund and generates an overall cash-on-cash return of 50% over the fund’s lifetime. However, adding leverage to the capital structure allows the fund to significantly alter the IRR outcome by accelerating cash distributions.
Now, adding leverage to the capital structure increases the portfolio’s risk level and hence raises the question whether an investor is appropriately compensated with excess returns for taking on this additional risk.
How do we figure that out?
For decades the capital asset pricing model (CAPM) developed in the early/mid 1960s, together with the associated Sharpe ratio, or reward-to-variability ratio, has helped investors to understand the relationship between risks taken and associated rewards generated.
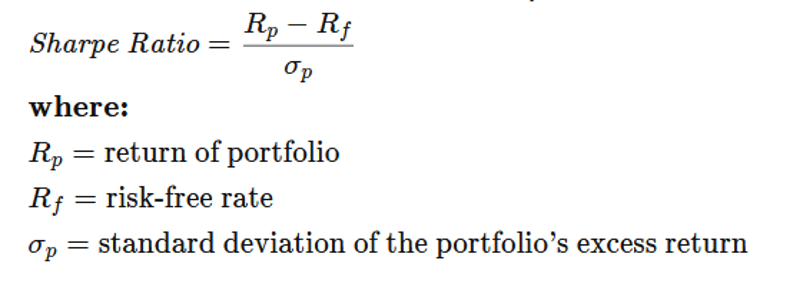
In a nutshell, the Sharpe ratio represents the relationship between an investment’s excess return (Rp – Rf) above and beyond a risk-free rate and its volatility. Comparing Sharpe ratios of existing investment pools to potential new investments allows one to make educated investment decisions.
The most important function from a capital allocators’ perspective, though, is the use of Sharpe ratios to rank various assets (or asset pools) for purposes of portfolio construction and investment selection.
Applying this wisdom to our simplified scenarios above results in the following outcome:
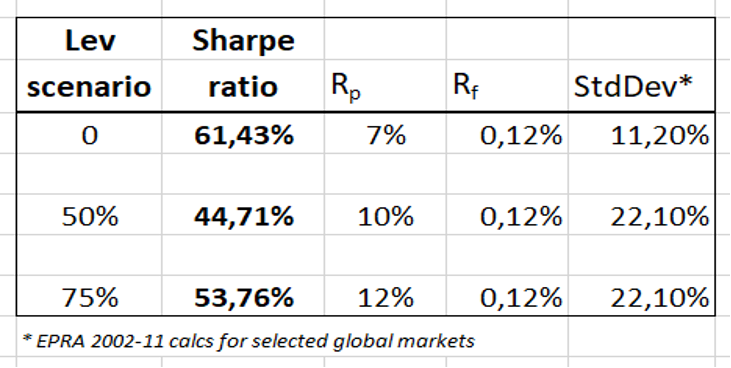
The highest Sharpe ratio indicates that, despite a lower absolute return of 7%, the unlevered scenario provides a better risk-adjusted return compared with the two levered scenarios.
In other words, in order to adequately compensate the equity investor for the additional leverage risk, both levered portfolios would require an IRR of 14% (Excel goal-seeked) instead of the 10% and 12% achieved, respectively (disregarding standard deviation variances between 50% and 75% gearing levels).
Being insufficiently compensated for assumed risk raises the question whether capital allocations elsewhere would have resulted in an overall portfolio structure with more favorable risk/return characteristics.
So, is the Sharpe ratio universally applicable across an entire investment portfolio?
Not without some liquidity caveats. Recent research comparing the volatility of listed (REIT) and private real estate for instance showed that private real estate volatility underestimates the true risk load. As such the research concludes that private real estate’s volatility has been significantly understated compared with (liquid) publicly traded REITs and hence needs to be adjusted accordingly for purposes of Sharpe ratio calculations in order to allow meaningful conclusions.
Where does this leave us?
It is paramount for (fiduciary duty-bound) capital allocators to keep in mind that performance evaluation is an art as much as it is a science. Apart from IRRs and Sharpe ratios, well-rounded investment decision-making also involves a variety of other quantitative and qualitative elements, like vintage year comparison, GP skill set, track record, and platform stability.
Only with a sufficient amount of legwork will we be able to reduce the risk of not getting (appropriately) paid as investors. Hence the rock band Dire Straits were spot when describing hard (investment) work thus: “Maybe get a blister on your little finger, maybe get a blister on your thumb.”


