


In this article I look at the S&P 500’s response to the coronavirus pandemic, the impact on CAPE valuations and what that means for the index’s expected ten-year returns.
The world is in the grip of a rapidly expanding pandemic and countries around the world have shut down large parts of their economies and told citizens not to go outside.
The International Monetary Fund (IMF) now expect a global recession far worse than the one that followed the financial crisis and worse than any since the great depression.
Companies left, right and centre are suspending dividends and reporting revenues declines of more than 80%.
And yet despite the obvious damage being done to the global economy, the S&P 500 is not even in bear market territory.
Wot no bear market?
Okay, I lied. The S&P 500 did dip into bear market territory for a few weeks between early March and the start of April.
Having reached (yet another) record high of 3,390 in February, the US large cap index collapsed with record speed, losing more than 1,150 points (34%) in just a few weeks.
The technical definition of a bear market is a decline of 20%, so clearly the S&P 500 was in a bear market, at least for a short while.
However, over the last few weeks the market has become enthusiastic once again, with the S&P 500 gaining 28% in about three weeks.
Today (15th April) the S&P 500 sits at 2,850. That’s a mere 16% below its all-time high, which means the bear market is (for now) technically over.
So what does that mean for valuations? In other words, is the S&P 500 cheap after those double digit declines?
The short answer is no, but to understand why, we need to look at what valuations were like before the pandemic struck.
The S&P 500 went into the pandemic crash with sky high valuations
For most active investors this isn’t exactly news, but the S&P 500 has been expensive for a very long time, at least according to its long-elevated CAPE ratio (cyclically adjusted PE).
Expensive means comfortably above average, which in this case means above 17.5. That’s the S&P 500’s average CAPE ratio (the ratio of price to ten-year average inflation adjusted earnings) over the last 100 years.
When the S&P 500 was at its pre-crisis peak of 3,390, its CAPE ratio stood at 30.6. That’s a massive 75% above its hundred-year average.
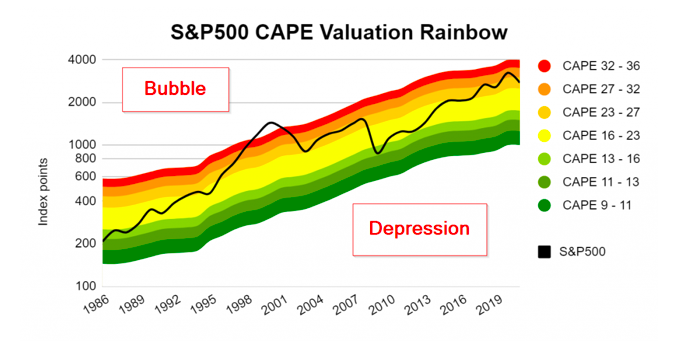
To put this in context, the chart below show the S&P 500 over the last 30 or so years. The colours on the rainbow tell you whether the index was expensive, cheap or somewhere between:
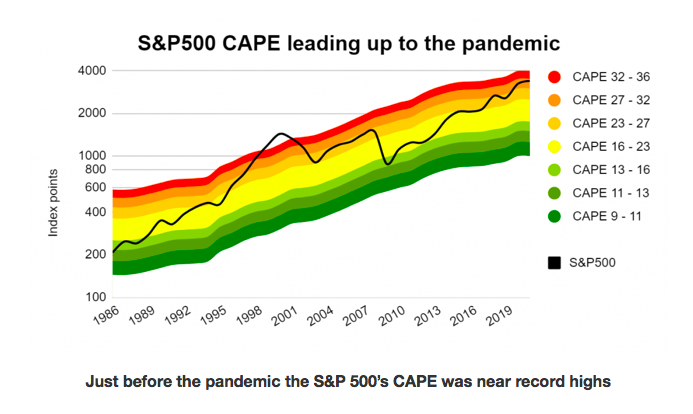
Just before the pandemic the S&P 500’s CAPE was near record highs
Hopefully the colour-coding is fairly intuitive, but if not then here’s a quick guide:
Bright Red = very expensive (CAPE almost twice the average)
Yellow = normal (CAPE close to average)
Dark Green = very cheap (CAPE almost half the average)
For example:
In 1999: Thanks to the tech bubble, CAPE was literally off the charts and well above twice its long-run average. Five to ten-year returns from this point were terrible, as expected.
In 2009: CAPE was pretty cheap thanks to the financial crisis. Five to ten-year returns from this point were very good, also as expected.
In 2019: CAPE was bordering on very high at around 75% above average. Five to ten-year returns from this point were expected to be poor.
Related: Cranswick’s low dividend yield implies a bright future, but is that likely?
So the S&P 500 went into this pandemic at sky high valuations, and yet so far has suffered relatively muted declines.
What does that mean for current valuations?
Believe it or not, the S&P 500 is still slightly expensive
I find this incredible.
We’re in the middle of a global pandemic which is potentially worse than any we’ve seen for a hundred years.
We’re staring down the barrel of what is very likely to be the worst global recession since the great depression of the 1930s.
Many companies are earning almost no revenues, with almost every trading update mentioning a suspended dividend, application for government loans or grants, layoffs, pay cuts, capex suspensions, rights issues and other drastic measures to increase their odds of survival.
This is not what I’d call a rosy picture. And yet in the middle of all this, the S&P 500 has rallied to the point where:
- the S&P 500 isn’t even in a bear market anymore
- it’s higher than it was just over a year
ago, when all we had to worry about was a tit fortat trade dispute between the US and China
- it’s still slightly expensive by historic standards
Let’s put some numbers on this.
Having started 2020 with a CAPE ratio as high as 30.6, the S&P 500’s initial 34% decline took that down to 20.2.
20.2 is lower than 30.6, but even at their most bearish, investors were still willing to place an above average valuation on US large caps.
But that was before the US government announced its $2 trillion support package.
Following the announcement of that support package, investors became even more optimistic, driving the S&P 500 up by more than 25%.
To date, this relief rally has brought the S&P 500’s CAPE ratio back up to 25.7, some 47% above its long-term average of 17.5.
It also puts the index squarely back into my “slightly expensive” CAPE range, which is the slightly orange band in the chart below:
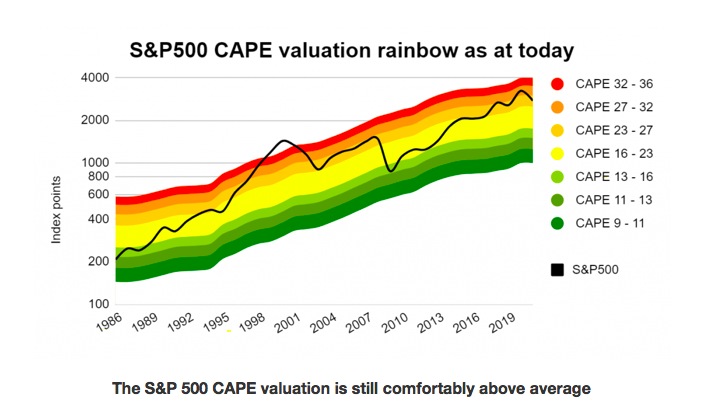
The S&P 500 CAPE valuation is still comfortably above average
To be honest, I’m amazed at how resilient the US market has been to this crisis.
There are lots of possible reasons why the S&P 500 has been so resilient. Many would say it’s down to the S&P 500’s heavy weighting to the infamous FAANG / FAMAG stocks (Facebook, Amazon, Microsoft, Apple, Netflix, Google / Alphabet).
The S&P 500’s exposure to these companies is currently around 20%. That’s a lot, and while I suspect these companies will be more defensive than most through this crisis, I’m not sure it’s enough to explain why the S&P 500 has been so robust.
I think there are three more important reasons:
1) US investors are being optimistic: The IMF and many investors expect a significant rebound in 2021. I hope they’re right. If the global recession is V-shaped then long-term earnings and therefore stock prices should only be impacted to a small degree.
2) US investors have become used to high valuations and low yields: The pre-crisis US bull market was the longest in history, and when people live in a certain environment for long enough they think it will never end.
Even when a global pandemic comes along, they cannot imagine the market falling by 50% or more, or CAPE declining into single digits. And since market prices are driven largely by investor sentiment, neither of those things have happened (yet).
3) US investors remember what happened after the last crisis: In 2008-2009 the global financial system teetered on the edge of collapse. It didn’t collapse because governments and central banks put in place huge support packages to protect the financial system and the therefore (hopefully) rest of the economy.
This worked so well (at least so far) that the US market recovered from the lows of 2009 and went on to produce the longest bull market ever, with returns of almost 400% over ten years.
That memory is still fresh in the minds of many investors, so perhaps they expect a similarly spectacular bull market once this crisis is over.
I’m not saying the market is right or wrong to have only reduced the S&P 500 by less than 20% from its all-time high. What I am saying is that as a result of this tiny decline, the S&P 500 is still somewhat expensive by historic standards.
This is in stark contrast to the relative cheapness of FTSE 100, where the FTSE 100’s CAPE ratio was about average at the start of the year (when it stood at 7,542), but is now 25% or so below its long-term average (with the index now at 5,790).
A quick S&P 500 long-term forecast
To finish up, here’s a quick projection of where the S&P 500 could be ten years from now, if it’s CAPE ratio is close to its long-term average of 17.5.
Here are the assumptions I’m going to use:
US CPI inflation stays close to 2%, which is the average for the last 20 years
S&P 500 real earnings growth stays close to 4%, which is the average for the last 20 years
Nominal S&P 500 earnings growth therefore runs at 6%
S&P 500 CAPE returns to its 100-year average of 18 (rounded up from 17.5 to keep the optimists happy)
These three assumptions give us the following projection:
S&P 500 cyclically adjusted earnings would increase by 79% over the next ten years
This would take them from 105.9 index points today to 189.6 index points in 2030
The S&P 500 would be at 3,413 in 2030
That’s less than 1% higher than the record set earlier this year.
High valuations lead to low expected long-term returns
Obviously I’m not saying the S&P 500 will be at exactly 3,413 in 2030.
What I’m saying is that 3,400 or so is a reasonable estimate of where the index might be if inflation, earnings growth and valuations were at historically normal levels.
In reality the S&P 500 could be a lot higher than 3,400 in 2030, and it could just as easily be a lot lower.
Without the benefit of a crystal ball, the sensible thing to do is to expect things to be ‘normal’ in the future.
If we do that then we should expect the S&P 500 to have produced very little in the way of capital gains by 2030.
Article originally published by UK Value Investor.


