
Those of you that have invested in the equity markets might remember the late Richard Crossley. Prior to his untimely death almost seven years ago, Richard was an “old school” technical analyst; always at his desk by 6.30am, he spent the morning pouring over hundreds of charts. This rigorous discipline, he used to tell me, enabled him to get to his lunch table by midday. Although he was rarely seen in the afternoon, it didn’t stand in the way of being voted the city’s number one technical analyst in the Extel rankings on several occasions.
One of the many things that I learnt from Richard was the fact that volumes paint a very good picture of where we stand in the life of a market.
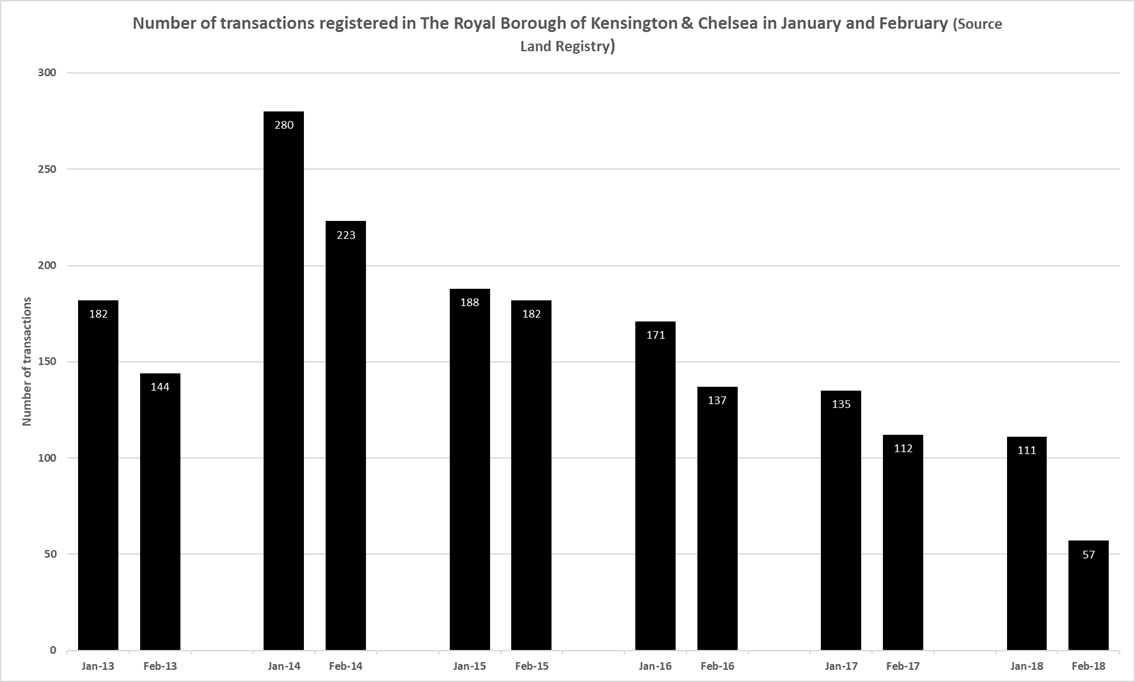
Which brings me to the chart below. Whilst reviewing the performance of The Prime Central London (PCL) residential market I looked at the Land Registry data for the first two months of this year in The Royal Borough of Kensington & Chelsea (a good proxy for PCL) to see how the current market compares to past years. As you can see, the results are quite shocking – which begs the question: is this level of transactions the new norm?
The first thing to bear in mind is that although the Prime Central London residential property market was the first to recover post the global financial crisis – the Savills PCL Flats index rose 85% between March 2009 and June 2014 – their latest numbers show that, since the summer of 2014, the prime central London flats index has declined 18.2% and their prime central London house index has declined by 15.5%. This price action, combined with current volumes, indicate that we are in real bear market territory.
In order to understand the volume question, let’s remind ourselves of the list of headwinds that Prime central London Residential property has suffered over the last 4 years.
The first catalyst that set the ball rolling was the threat of a mansion tax. Initially touted as a wealth tax, the subject had become part of the mainstream political discussion during 2014. With a General Election due in 2015, George Osborne’s counter attack came in the Autumn budget of 2014. To head off the politically sensitive criticism that property assets of the rich were undertaxed, he introduced an aggregated SDLT regime which increased effective rates on transactions valued over £937,500; overnight a buyer of a property priced at £3m had to pay a new rate of 9.13%, against the old rate of 7%. At the very top end of the market buyers found themselves paying almost 5% more than the old rates.
The decision to levy capital gains tax on foreign / overseas owners of UK residential property on any capital increases post April 2015 was a further headwind, but wasn’t as severe as Osborne’s decision, announced later that year at his post-election budget, to impose an additional 3% rate of SDLT on all buyers of second homes. Primarily designed to keep investors from competing with first time buyers, it proved to be a hammer blow at the top end of the market. (Remember that the £3m property, if bought by an investor, was now liable for a total SDLT rate of over 12%).
Although academic research* has concluded that it is the seller who bears the brunt of any rises in SDLT via price reductions, in many instances sellers in Prime continued to hold out for higher prices, reinforcing a long-held view that because many owners in prime are debt free, they are rarely forced sellers. When prices fall they simply dig their heels in and don’t sell.
Notwithstanding the above, probably the single largest exogeneous shock that the market could have received was the UK’s vote to leave the European Union, which some believe will significantly diminish London’s role as a global centre. Uncertainty creates fear and if you believe that markets move on greed and fear – then here was the perfect excuse for buyers to remain on the side lines. Add to this mix the fact that our recent political upheavals have produced a labour opposition led by Jeremy Corbyn then you can further understand the current level of transactions.
And what of bear market psychology? Price declines in any market can often produce stagnant volumes. Buyers hesitate, fearing that what they’ve bought will be worth 10% less in six months time.
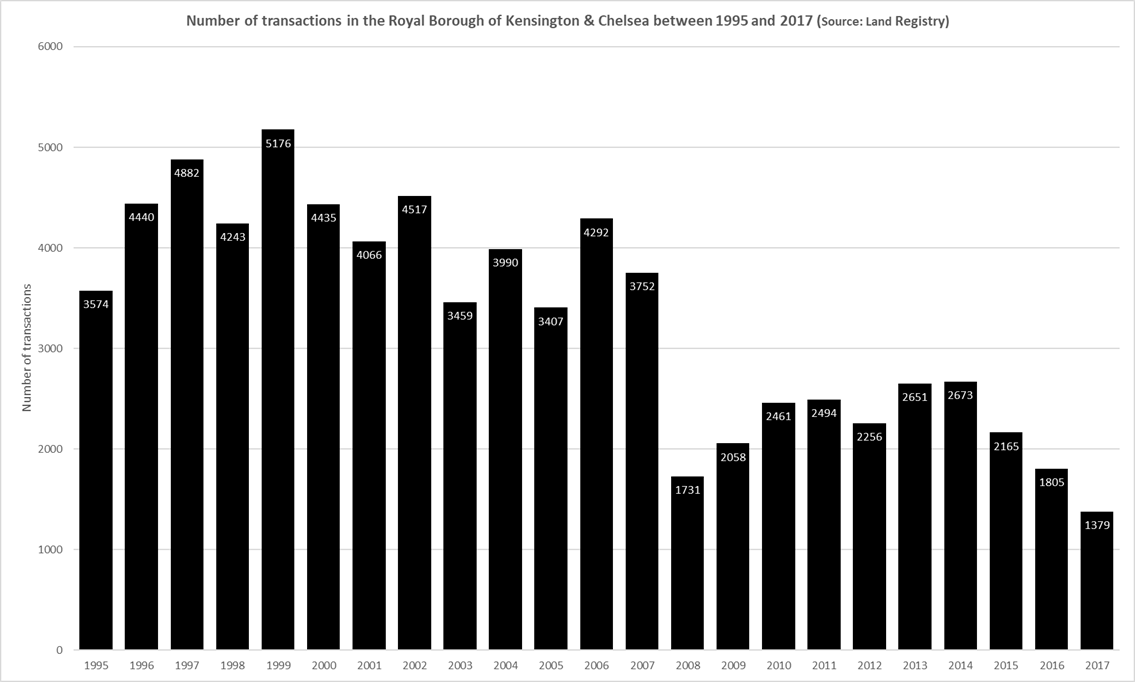
All of this explains that first chart. So what does the future hold for volumes in PCL? At this stage of a bear market participants can rarely see the end to their woes; but the point is that many of the factors that are currently impacting volumes could change in the next year or so. Brexit may deliver some degree of clarity, perhaps even positive news. The second chart (below) gives a broader perspective on long term volumes. Admittedly the new norm post the global financial crisis is that volumes are structurally lower. However, the weight of evidence looking forward suggests that once the Brexit uncertainty is removed we can expect a leg up from the current low volumes.