


The physical market cycle analysis of five property types in 54 metropolitan statistical areas (MSAs).
So unique – GDP growth dropped 1.4% in 1Q22, yet the Federal Reserve still increased the Fed Funds rate by 0.5% instead of 0.25%, a jump they have not done in 20 years. Supply chain pressure continued pushing prices up and the labour market got even tighter, but wage growth did not keep up with the CPI. The stock market is repricing risk with a 20% decline YTD and short-term interest rates have jumped with 10-year treasury at 3+%. Add the oil shock and food price increases to keep the economy slower. But – it is employment that drives demand for real estate and that demand (with 438,000 more jobs in April) is strong, pushing occupancies up in almost all cases.
Office occupancy decreased 0.1% in 1Q22 and rents increased 0.2% for the quarter, but were down -0.7% annually. Industrial occupancy improved 0.2% in 1Q22, and rents grew 1.7% for the quarter and were up 7.4% annually. Apartment occupancy decreased 0.1% in 1Q22, and rents grew 2.5% for the quarter and were up 4.2% annually. Retail occupancy improved 0.2% In 1Q22, and rents grew 0.6% for the quarter and were up 1.9% annually.
National property type cycle locations
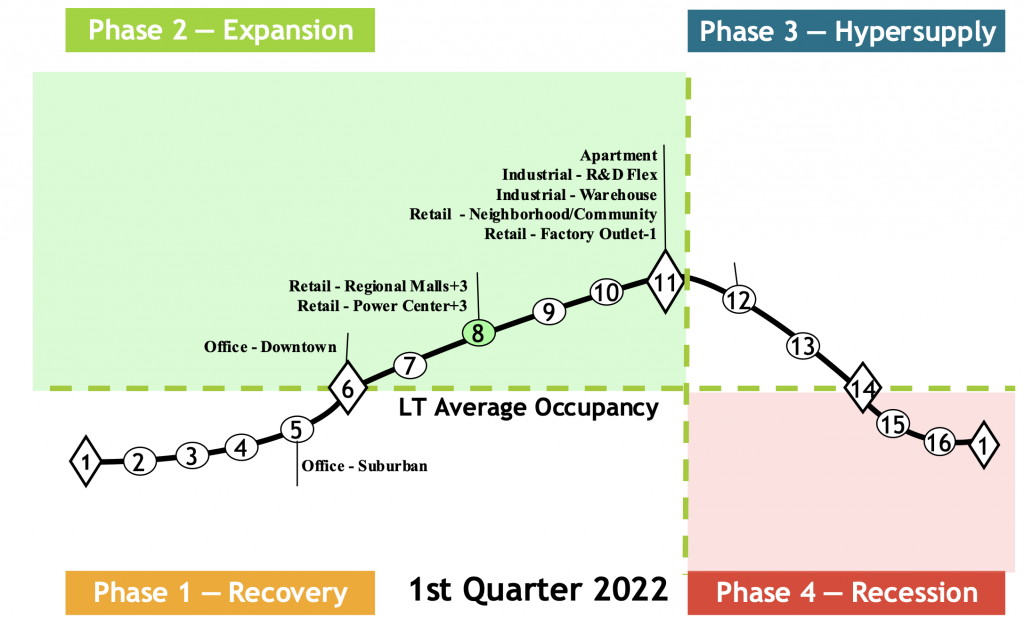
The cycle monitor analyses occupancy movements in five property types in 54 MSAs. Market cycle analysis should enhance investment-decision capabilities for investors and operators. The five property type cycle charts summarise almost 300 individual models that analyse occupancy levels and rental growth rates to provide the foundation for long-term investment success. Commercial real estate markets are cyclical due to the lagged relationship between demand and supply for physical space. The long-term occupancy average is different for each market and each property type. Long-term occupancy average is a key factor in determining rental growth rates – a key factor that affects commercial real estate income and thus returns.
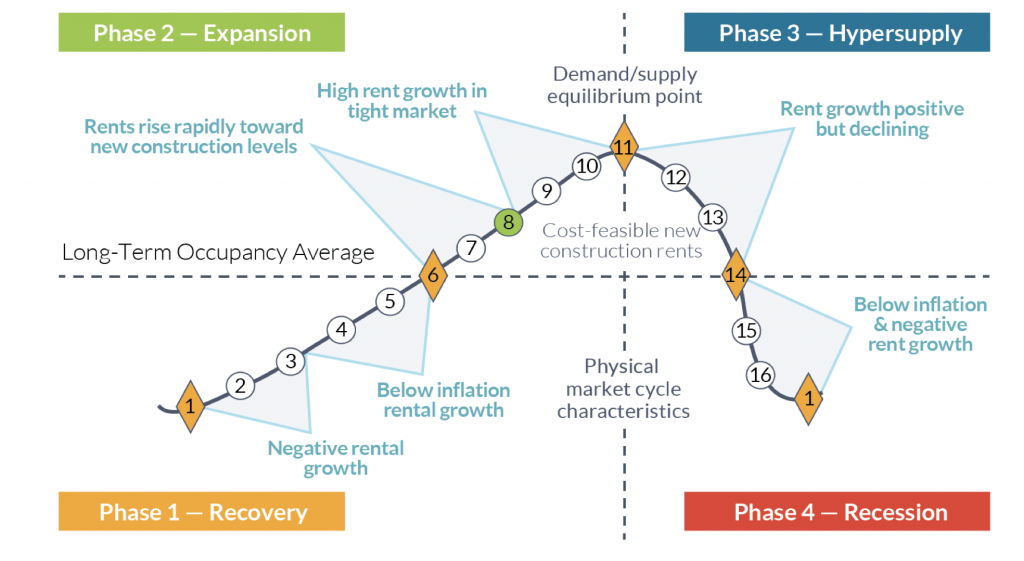
Market cycle quadrants
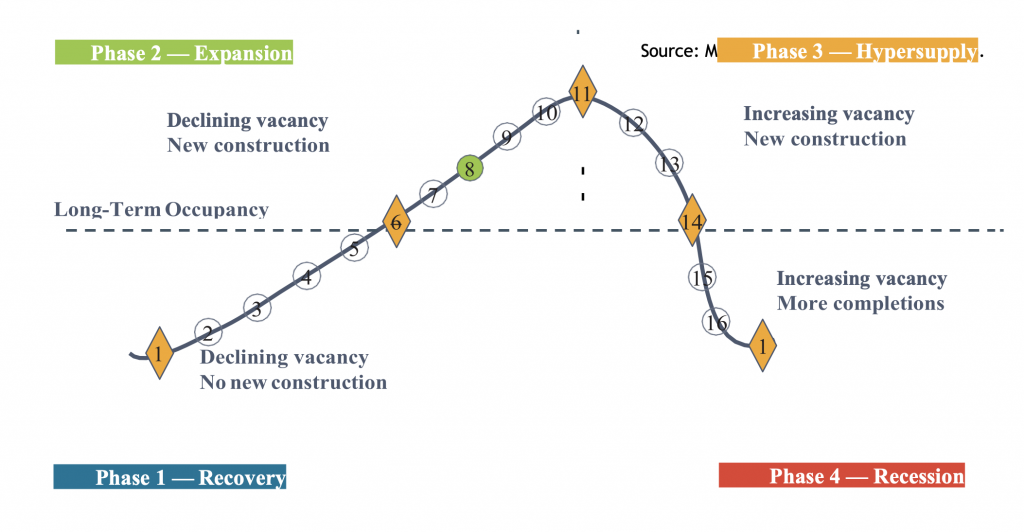
Rental growth rates can be characterised in different parts of the market cycle, as shown below.
Office
The national office market occupancy level decreased 0.1% in 1Q22 and was down 0.2% year-over-year. However, demand picked up in many markets and the forecast now shows increasing occupancies in the future, moving many markets into the recovery and growth phase of the cycle. There have been many new large major employer headline leases to a provide positive outlook, but many markets saw firms with lease expirations taking less space than they had in the past. Our positive demand outlook comes from the continued strong US employment growth with 428,000 jobs created in April 2022. All levels of space quality have seen reasonable leasing activity in Q1, but renovations to attract employees back are booming. The high-cost gateway markets like New York, San Francisco and Los Angeles hit their cyclical bottoms, as migrations to second-tier markets continue. Average national asking rents improved 0.2% in 1Q22 but were down 0.7% year-over-year.