


The report is divided into the following sections:
1) A summary of 2018 performance
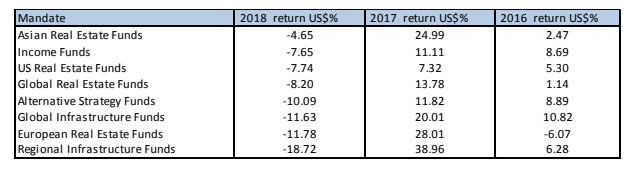
The table below, shows the average 2018 performance per mandate, and is ranked by 2018 returns with 2017 and 2016 figures for comparison. As can be seen no individual mandate generated positive returns, although this is in the context of negative calendar returns for virtually all asset classes.
2) Focus : Annual Performance Review (p4)
This month we look at the 2018 performance of our different fund mandates in the context of:
i) The last 5 years absolute performance