


The Physical Market Cycle Analysis of 5 Property Types in 54 Metropolitan Statistical Areas (MSAs).
The 2018 economic expansion continued at a moderate pace with a slightly higher GDP growth rate than the past five years. Employment growth continued to increase at an average 200,000+ job increase per month. The Federal Reserve recently put their interest rate hikes on hold, with expectations of a cooling economy, and 10- year treasury rates dropped back below 3%, thus CRE debt costs remain moderate. All favorable trends for real estate. New supply growth is slowing in all property types with higher labor and construction costs.
Office occupancy increased 0.4% in 4Q18, and rents grew 0.3% for the quarter and 2.0% annually. Industrial occupancy was flat in 4Q18, and rents grew 2.4% for the quarter and 5.9% annually.
Apartment occupancy decreased 0.1% in 4Q18, and rents were flat for the quarter, but grew 3.1% annually. Retail occupancy increased 0.1% in 4Q18, and rents grew 0.1% for the quarter and 1.5% annually.
Hotel occupancy declined 0.1% in 4Q18, and room rates were flat for the quarter but grew 3.9% annually.
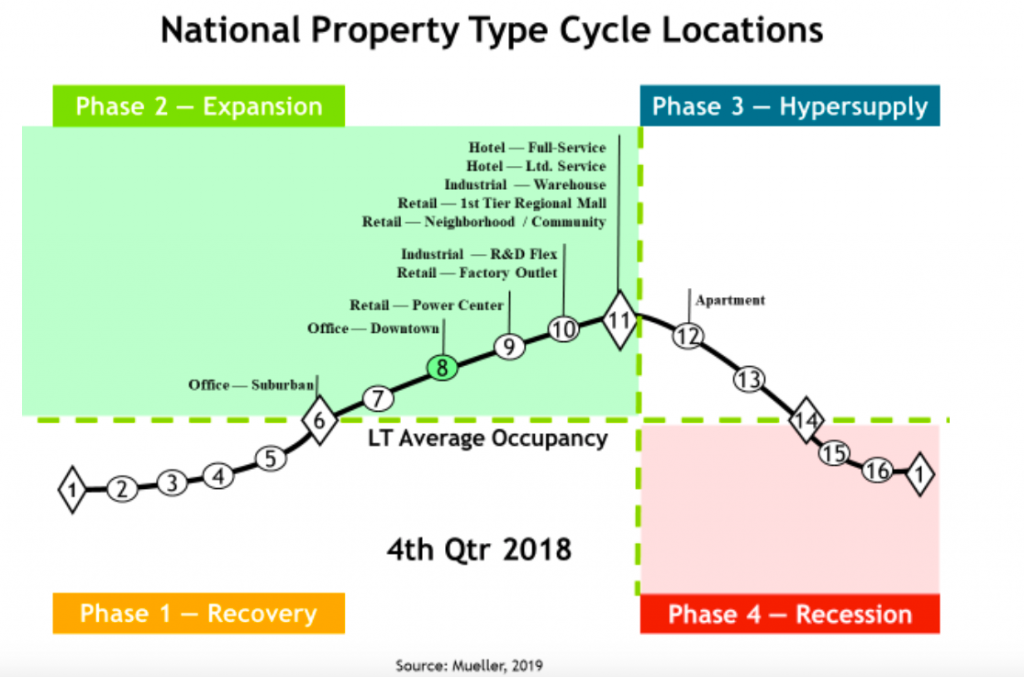
The National Property Type Cycle Locations graph shows relative positions of the sub-property types.
The cycle monitor analyzes occupancy movements in five property types in 54 MSAs. Market cycle analysis should enhance investment-decision capabilities for investors and operators. The five property type cycle charts summarize almost 300 individual models that analyze occupancy levels and rental growth rates to provide the foundation for long-term investment success. Commercial real estate markets are cyclical due to the lagged relationship between demand and supply for physical space. The long-term occupancy average is different for each market and each property type. Long-term occupancy
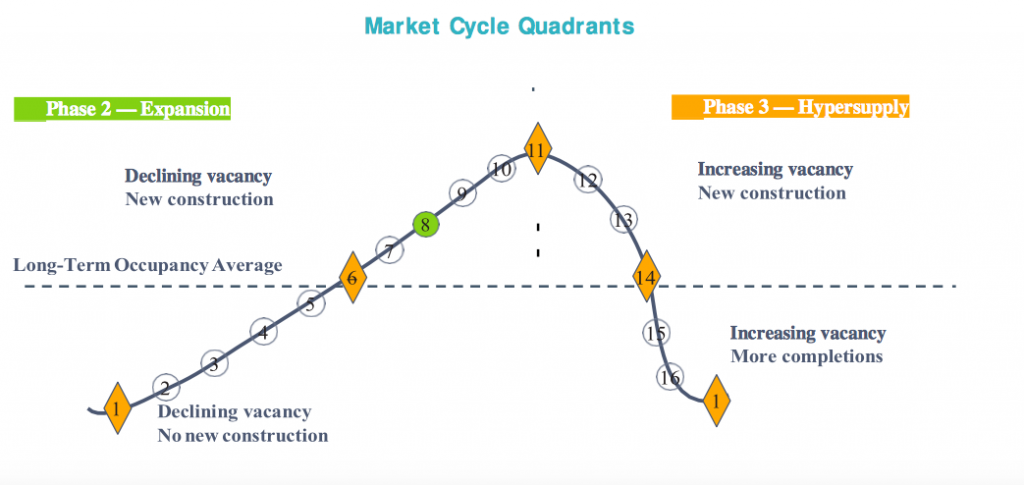
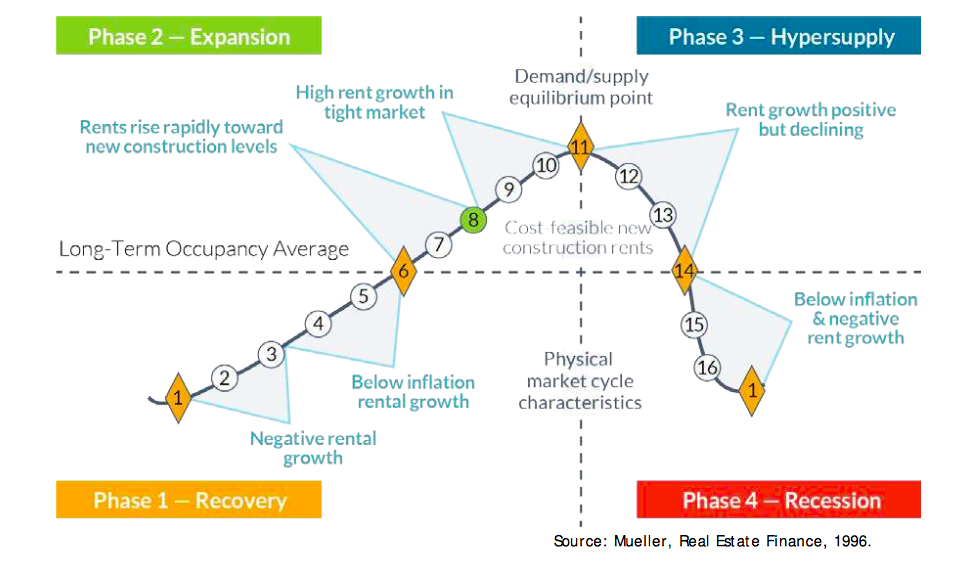
Rental growth rates can be characterized in different parts of the market cycle, as shown below.
Office
The national office market occupancy level increased 0.4% in 4Q18 and was up 0.6% year-over-year. Office demand continued to improve, as employment growth above 200,000 jobs per month created additional need in this moderately growing economy. New supply at a lower growth rate than demand helped to inch the national occupancy level higher. There were only five markets where occupancy increased enough to advance them one point in the cycle graph. Local “economic base” industries creating different demand growth levels, have spread cities across all points in the expansion phase of the cycle. Average national rents increased 0.3% in 4Q18 and produced a 2.0% increase year-over-year.