


What on earth is going on?
MSCI developed markets growth versus value
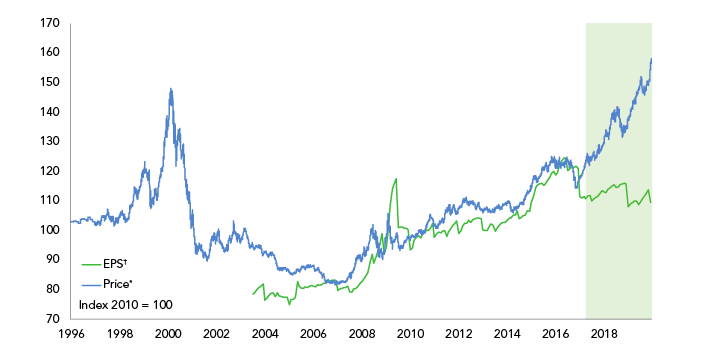
Source: Minack Advisors †Ratio of growth/value one year ahead forecast EPS *Growth/value indices for MSCI developed markets
Gravity is a universal constant. But it turns out that zero interest rates can suspend it – in financial markets, at least.
This week’s chart shows the performance of ‘growth’ versus ‘value’ share prices (blue). In green is the performance of ‘growth’ versus ‘value’ earnings.
When the lines rise (or fall) together, growth share prices and earnings are doing better (or worse) than their ‘value’ counterparts. When the lines diverge, relative share price movements are no longer tracking relative earnings strength.
Fierce debate over what constitutes ‘growth’ and ‘value’ companies is itself a universal constant. For our purposes, think US tech giants when you read ‘growth’. And think beaten-up financials and oil majors when you read ‘value’.