


To the delight of investors across the cryptosphere, the price of bitcoin (BTC) has rallied over 53% since its low of US$15,476 (£12,519) in November. Now trading around US$23,000, there’s much talk that the bottom has finally been reached for the leading cryptocurrency after a year of painful decline – in November 2021, the price peaked at almost US$70,000.
If so, it’s not only good news for bitcoin but the whole market in cryptocurrencies, since the others broadly move in line with the leader. So is crypto back in business?
Dotcom lessons
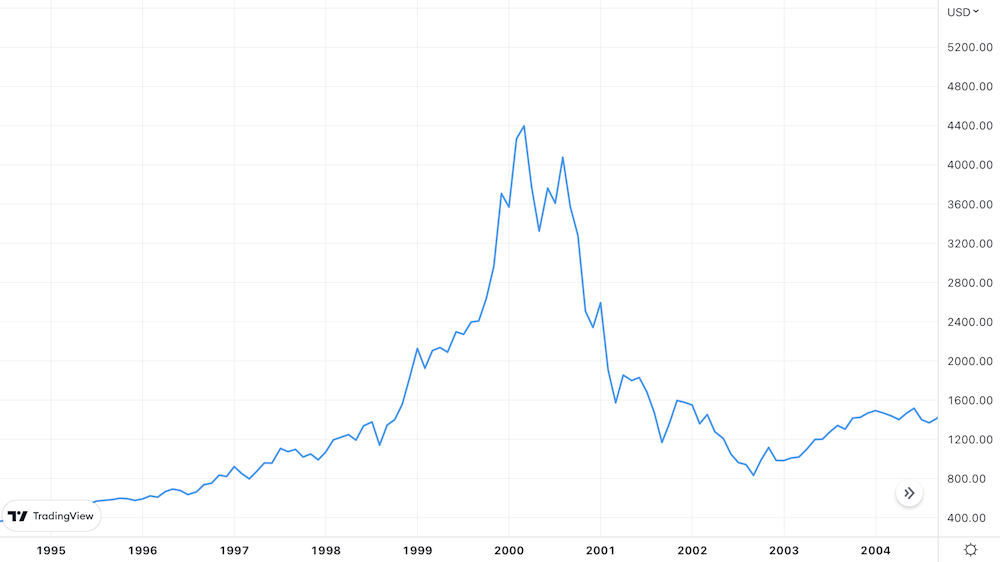
The past is littered with various periods of market turmoil, from the global financial crisis of 2007-09 to the COVID-19 collapse in 2020. But neither of these is a particularly good comparison for our purposes because they both saw sharp drops and recoveries, as opposed to the slow unwinding of bitcoin. A better comparison would be the dotcom bubble burst in 2000-02, which you can see in the chart below (the Nasdaq is the index that tracks all tech stocks).
Nasdaq 100 index 1995-2005
Look at the bitcoin chart since it peaked in November 2021 and the price action looks fairly similar:
Bitcoin bear market price chart 2021-23
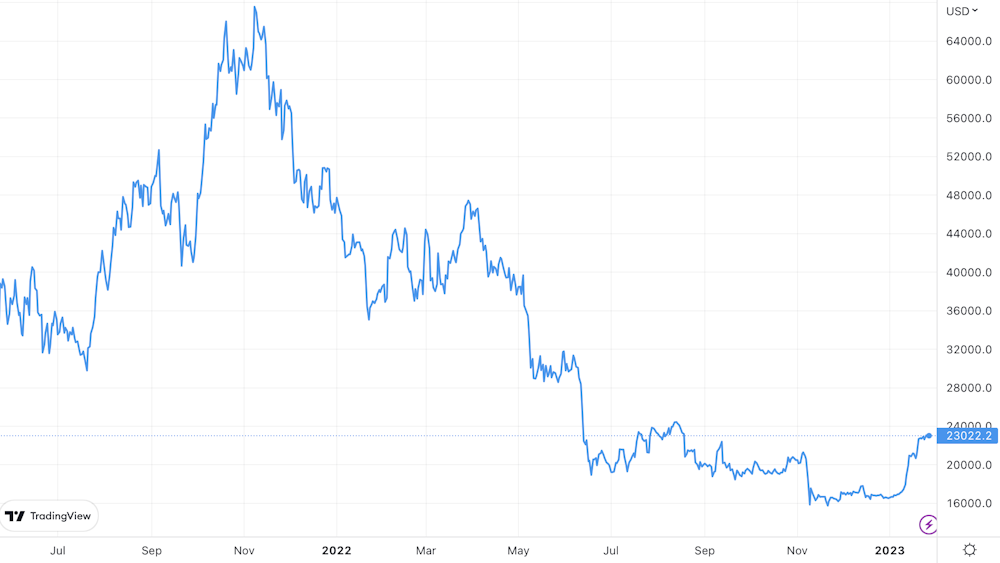
Both charts show that bear markets go through various periods where prices rise but don’t reach the same level as the previous peak – known as “lower highs”. If bitcoin is following a similar trajectory to the early 2000s Nasdaq, it would make sense that the current price will be another lower high and that it will be followed by another lower low.
This is partly because like the 2000s Nasdaq, bitcoin seems to be following a pattern known as an Elliott Wave. Named after the renowned American stock market analyst Ralph Nelson Elliott, this essentially argues that during a bear phase, investors shift between different emotional states of disappointment and hope, before they finally despair and decide the market will never turn in their favour. This is a final wave of heavy selling known as capitulation.