


ARTICLE ORIGINALLY PUBLISHED 9th MAY 2018
Introduction – the danger of being a farmer at MBA school (or at a dinner party)
MBA schools characterise farming as a commodity industry, subject to negative weather events and low returns. Farmers are often told at dinner parties that farming:
- is a low return asset class
- which produces commodity products, which cannot easily be differentiated
- making it a puzzle why land is so expensive
- with the prices being paid for farmland recently being particularly crazy!
A case study of one of these “expensive” assets: South Island New Zealand sheep and beef land
Over the years these views made sense to me also. Twenty years ago $3,000 per hectare for land in our valley seemed high. By the time my father died in 2004 they had risen to $6,000. Now they have again doubled to $12,000. At each stage of this process the farm was generating only 4% operating returns on assets*.
*This must have been true in the 1970s also as I can remember my father telling me then that “NZ sheep and beef farms will always yield only 3% to 5%”. With the benefit of hindsight I believe he was suggesting that as soon as they start to yield more farm prices will rise to bring the yield back down to their equilibrium range.
This commentary attempts to unpick the puzzle of an asset class that often looks very ordinary (or in a bad year downright unattractive) when looking at the current year’s financial accounts, yet so often looks good when looking in the rear view mirror.
Historic US Farmland returns
The graphs below summarise separate decades of data on the total returns** to US farmers and also looks at returns in a couple of other countries.
**these are returns on assets, including both operational returns and capital gains.
The 1970s
In the 1970s US farmland had a remarkable decade with annual total returns of 18.2% per annum in a period of stagflation when both equities and bonds had negative real returns. Farmland, gold, and other real assets benefited from the “flight to quality” in the face of high inflation and low growth.
Compounded Return of Selected US Assets Classes 1970-1979
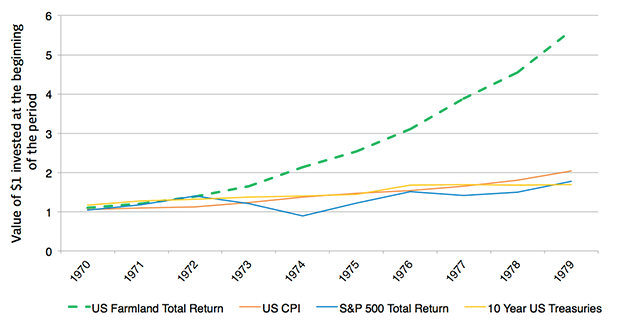
Source: Map of Agriculture analysis
The 1980s
The 1980s is the one decade in our sample when US farmland under-performed both US Treasury bonds and equities. In this decade US farmland, with 7% annualised returns, “normalised” – giving back some of the relative returns from the 1970s (when farmland valuations like gold, may have become over-extended).
Compounded Return of Selected US Assets Classes 1980-1989
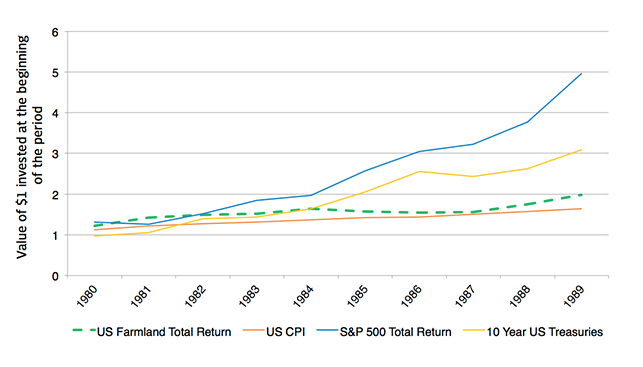
Source: Map of Agriculture analysis
The 1990s
The 1990s was an infamous period for agricultural over-production caused, primarily, by excessive subsidies (remember butter mountains and wine lakes). However US farmers still did ok with an annual growth of 12 % vs. equities at 17% and US Treasuries at 7%.
Compounded Return of Selected US Assets Classes 1990-1999